
Northeast Fisheries Science Center Technical Memorandum
350
Management Track Assessments Fall 2022
Northeast Fisheries Science Center
September 2022
Northeast Fisheries Science Center Technical Memorandum
350
Management Track Assessments Fall 2022
Northeast Fisheries Science Center
U.S. Department of Commerce
National Oceanic and Atmospheric Administration
National Marine Fisheries Service
Northeast Fisheries Science Center
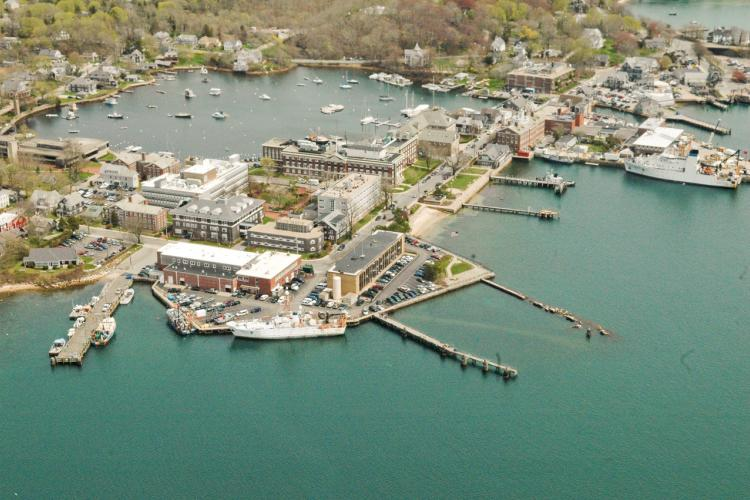
Woods Hole, Massachusetts
September 2022
NOAA Technical Memorandum, Editorial Notes
Editorial Treatment: In the interest of expedited publication, this report has undergone a truncated version of the NEFSC Editorial Office’s typical technical and copy editing procedure. Aside from the front and back matter included in this document, all writing and editing have been performed by the authors included on the title page.
Information Quality Act Compliance: In accordance with section 515 of Public Law 106-554, the NEFSC completed both technical and policy reviews for this report. These predissemination reviews are on file at the NEFSC Editorial Office.
Species Names: The NEFSC Editorial Office’s policy on the use of species names in all technical communications is generally to follow the American Fisheries Society’s lists of scientific and common names for fishes, mollusks, and decapod crustaceans and to follow the Society for Marine Mammalogy’s guidance on scientific and common names for marine mammals. Exceptions to this policy occur when there are subsequent compelling revisions in the classifications of species, resulting in changes in the names of species.
Statistical Terms: The NEFSC Editorial Office’s policy on the use of statistical terms in all technical communications is generally to follow the International Standards Organization’s handbook of statistical methods.
This document may be cited as:
NEFSC. 2022. Management Track Assessments Fall 2022. US Dept Commer, Northeast Fish Sci Cent Tech Memo. 350; 167p.+xv. Available from: National Marine Fisheries Service, 166 Water Street, Woods Hole, MA 02543-1026, or online at http://www.nefsc.noaa.gov/nefsc/publications/ .

Abbreviations and Acronyms
-
Albatrossrefers to activities of the NOAA vessel Albatross IV 2, 51, 84, 85, 127
-
Albatross IVResearch vessel NOAAS Albatross IV, in service until November 2008 viii, 125
-
AOPAssessment Oversight Panel 4–14, 20, 31, 32, 41, 53, 62, 74, 83, 95, 101, 105, 106, 113, 115, 124, 125, 156
-
ASMFCAtlantic States Marine Fisheries Commission 2, 5, 12, 14, 15, 82, 83, 91
-
Bigelowrefers to activities of the NOAA vessel Henry B. Bigelow 2, 10, 20, 61, 84, 85, 105, 125, 127
-
BTSbottom trawl survey 2, 84, 94, 100
-
CAMSCatch Accounting and Monitoring System 2, 5–7, 9–13, 20, 30, 39, 83, 105, 113, 144
-
CIECenter for Independent Experts 13, 61
-
CJFASCanadian Journal of Fisheries and Aquatic Sciences 94, 100
-
CRDCenter Reference Document CLXXXV
-
CSECouncil of Science Editors CLXXXV
-
DFODepartment of Fisheries and Oceans, Canadian 7, 8, 17, 38, 39, 47, 58, 74, 146
-
FSDFisheries Statistics Division 8, 71–74, 76, 77
-
F/Vfishing vessel 127
-
GARFOGreater Atlantic Regional Fisheries Office 1, 14, 15, 17
-
GARMGroundfish Assessment Review Meeting 6, 31
-
GARM III3rd Groundfish Assessment Review Meeting, 2008 10, 52, 53, 106, 144–146, 157
-
H.B. Bigelowrefers to activities of the NOAA vessel Henry B. Bigelow 51
-
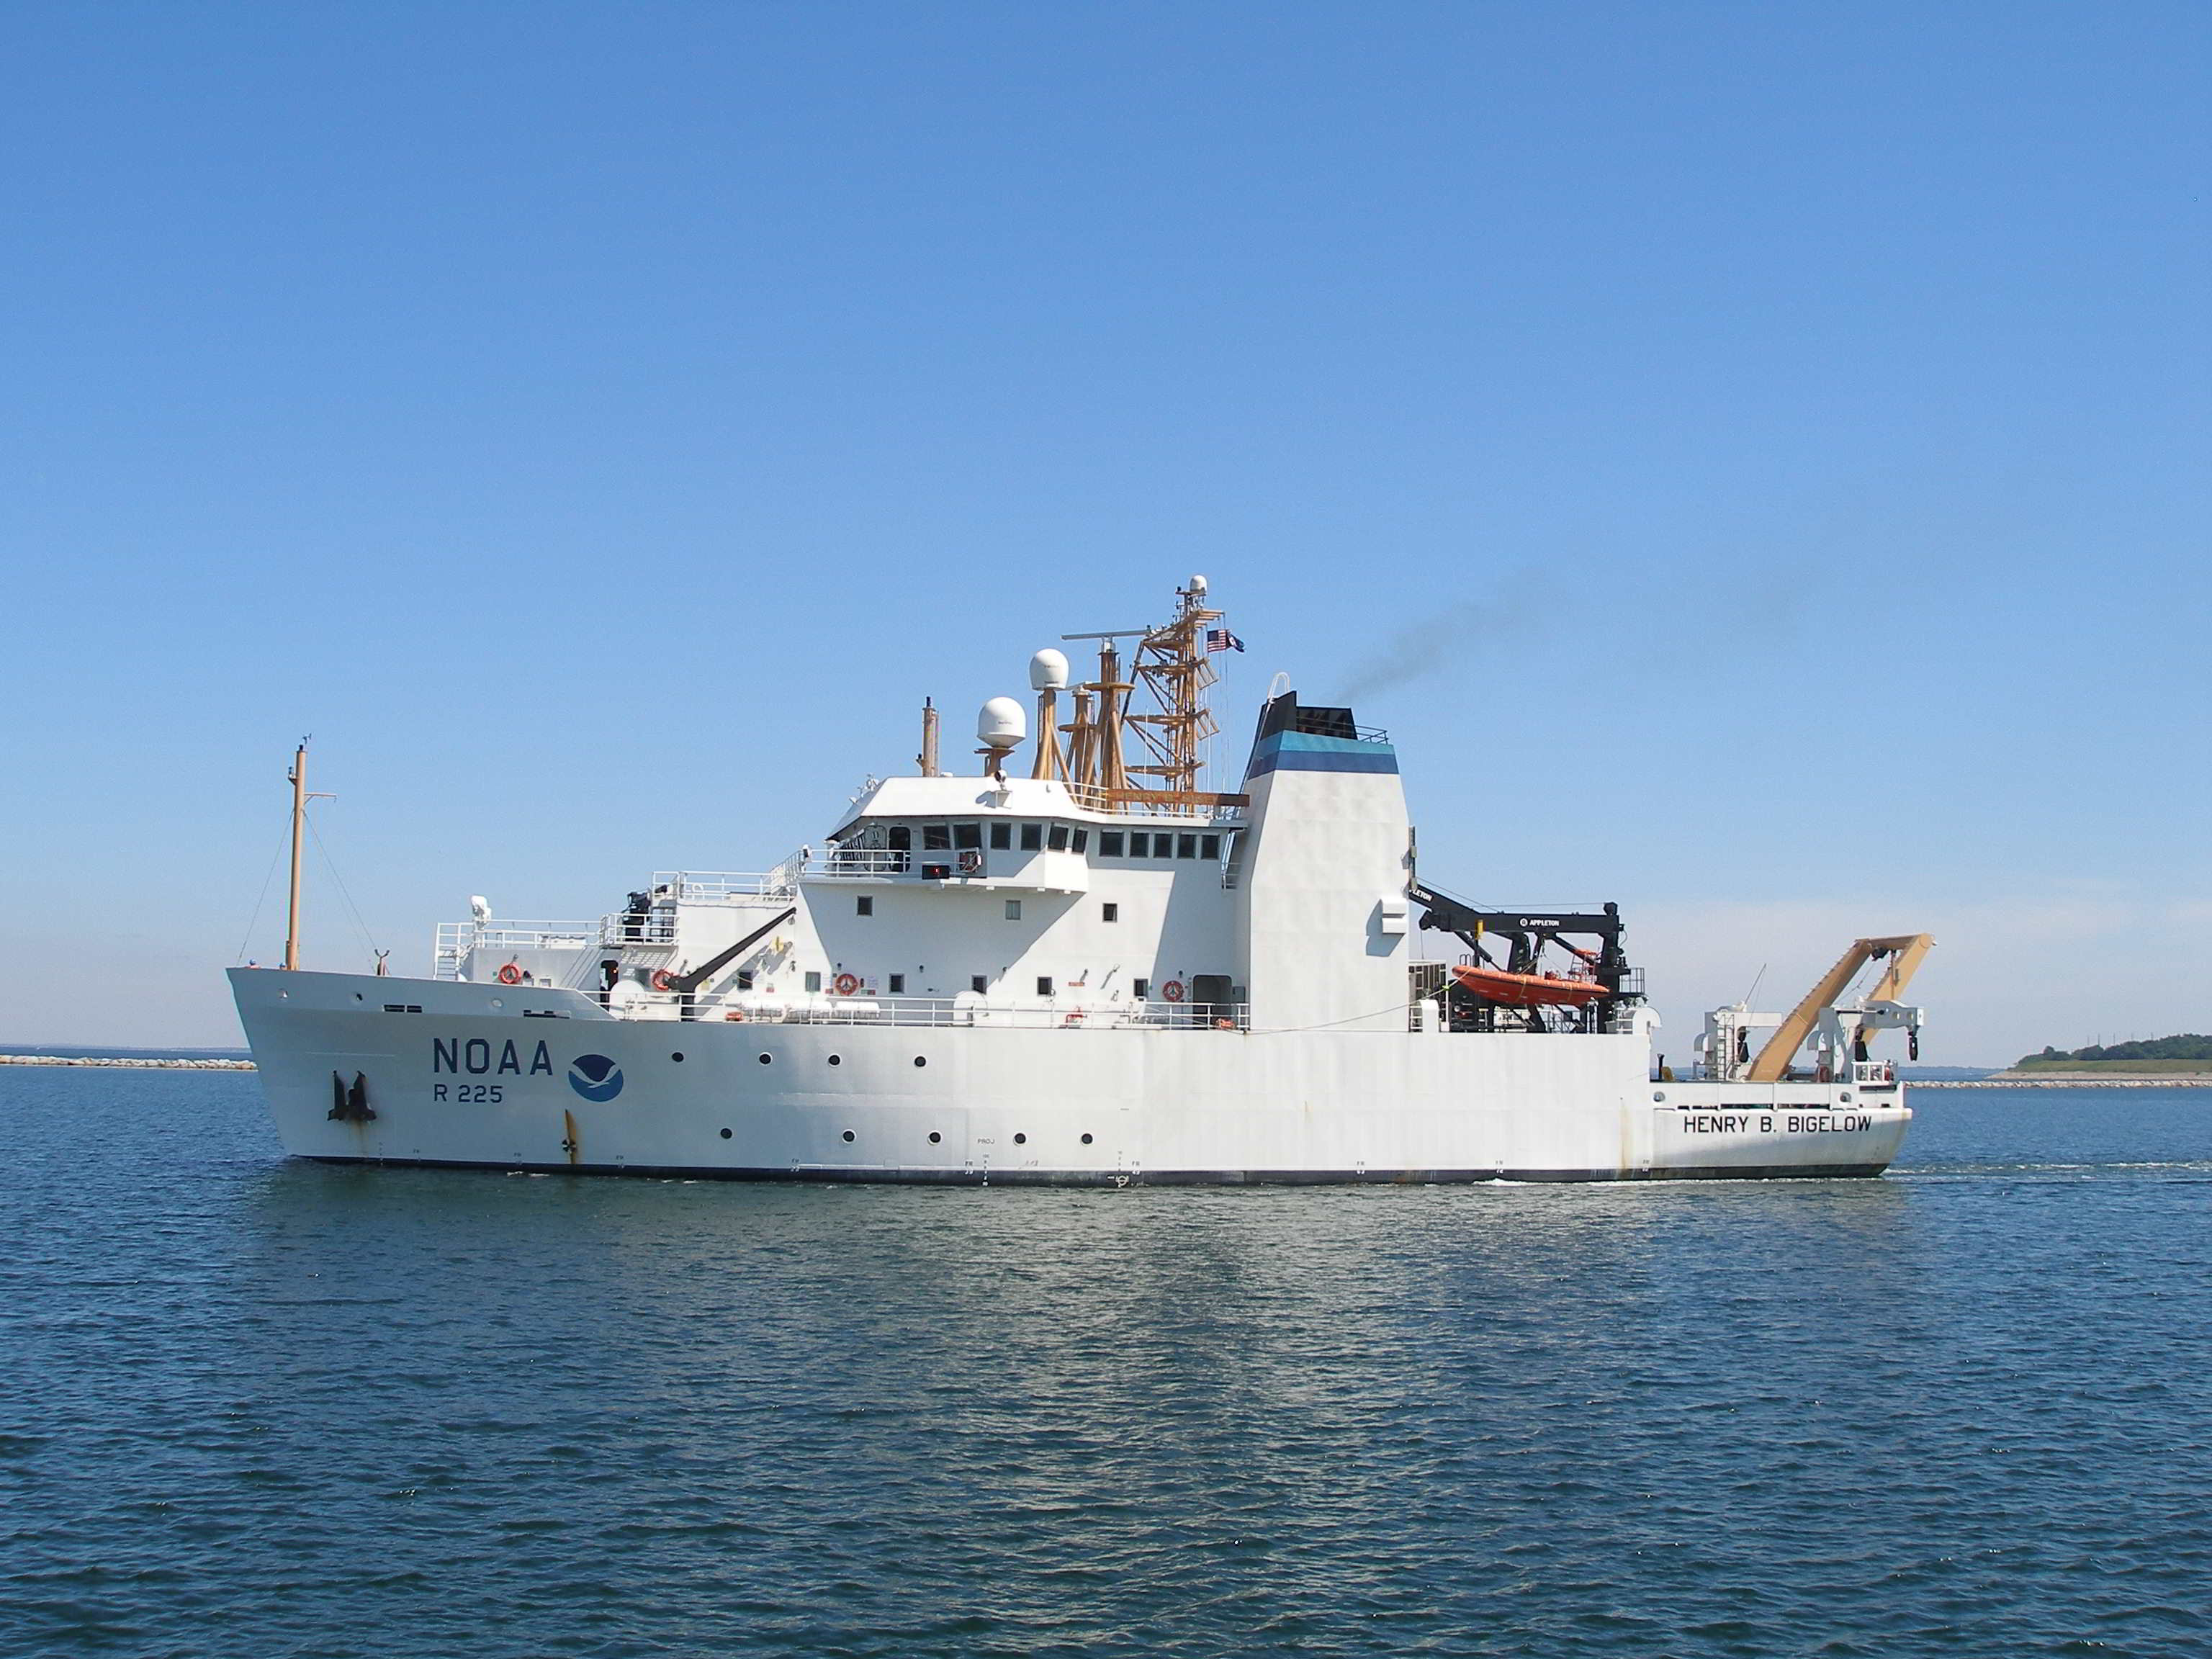
Henry B. BigelowNOAA research vessel Henry B. Bigelow, with specialized trawling net mechanisms; commissioned July 2007, used for surveys 2009–2019 vii, viii, 164
-
ICESInternational Council for the Exploration of the Sea (European Union) 157
-
MADMFMassachusetts Division of Marine Fisheries 6, 7, 10, 14–17, 27, 28, 31, 33, 34, 36, 143, 144, 151
-
MAFMCMid-Atlantic Fisheries Management Council 4, 14, 16
-
ME DMRMaine Department of Marine Resources 14, 16, 17
-
MRFSSMarine Recreational Fisheries Statistics Survey 12
-
MRIPMarine Recreational Information Program 7, 123
-
MTManagement Track 63, 64
-
NAFONorthwest Atlantic Fisheries Organization xii
-
NCDMFNorth Carolina Division of Marine Fisheries 17
-
NDPSWGNortheast Data Poor Stocks Working Group 6, 19, 20, 22
-
NEFMCNew England Fisheries Management Council 1, 4, 14–17, 106, 111, 135
-
NEFOPNortheast Fishery Observer Program 2, 6
-
NEFSCNortheast Fisheries Science Center III, 1, 2, 5–12, 14–17, 19–22, 27–31, 33, 34, 36, 37, 39, 41, 42, 47, 48, 50–52, 58, 59, 61–63, 70, 79, 80, 83, 85, 91, 94, 97, 100, 103–106, 110, 111, 113, 114, 120, 121, 125, 126, 133–136, 141, 143–146, 151, 152, 154, 156, 163, CLXXXIV, CLXXXV
-
NMFSNational Marine Fisheries Service 17, 64, 74, 85, 92, 94, 95, 98, 100, 101, 164, CLXXXIV
-
NOAANational Oceanographic and Atmospheric Administration vii–ix, xi, 1, 2, 4, 16, 41, 52, 53, 62, 71, 83, 86, 106, 137, 146, 156, 157, 164–CLXXXIV
-
NOAASNOAA ship viii
-
NRCCNortheast Regional Coordinating Council 4
-
PDTPlan Development Team 12, 135
-
RTResearch Track 63
-
R/Vresearch vessel 61
-
SARC 5050th Stock Assessment Review Committee meeting, 2010 121
-
SARC 5252nd Stock Assessment Review Committee meeting, 2011 28, 29, 31
-
SASINFStock Assessment Support Information 1, 114
-
SAW 5050th Stock Assessment Workshop, 2010 5, 126, 128
-
SAW 5252nd Stock Assessment Workshop, 2011 32
-
SAW 5454th Stock Assessment Workshop, 2012 11, 156, 157
-
SAW 5656th Stock Assessment Workshop, 2013 11, 12, 83, 86
-
SAW 6666th Stock Assessment Workshop, 2019 146
-
SMASTSchool for Marine Science and Technology (New Bedford, Maine) 15, 17
-
SSCScientific and Statistical Committee 14, 15, 64, 85, 106, 127, 135
-
TMGCTransboundary Management Guidance Committee 16
-
TORTerm of Reference 9, 62–64, 83–85, 125–127
-
TRACTransboundary Resources Assessment Committee 146
-
WHAMWoods Hole Assessment Model 5, 9, 13, 48, 49, 52, 53, 111, 113, 114, 155, 157
-
WHOIWoods Hole Oceanographic Institute, MA x, 17, 164
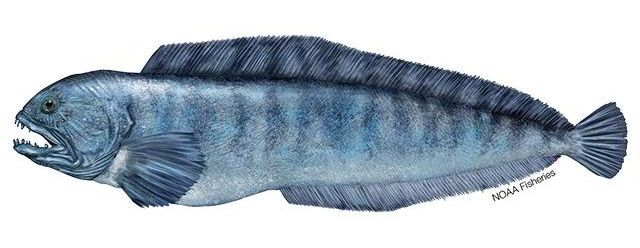
Atlantic Wolffish
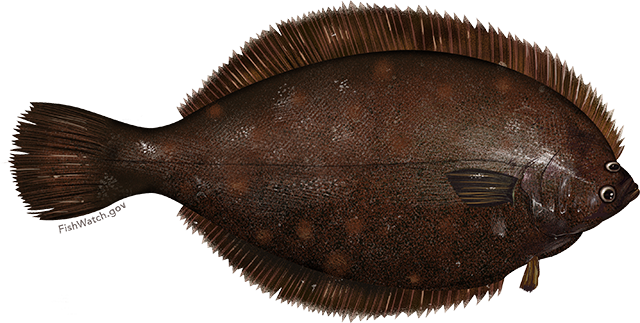
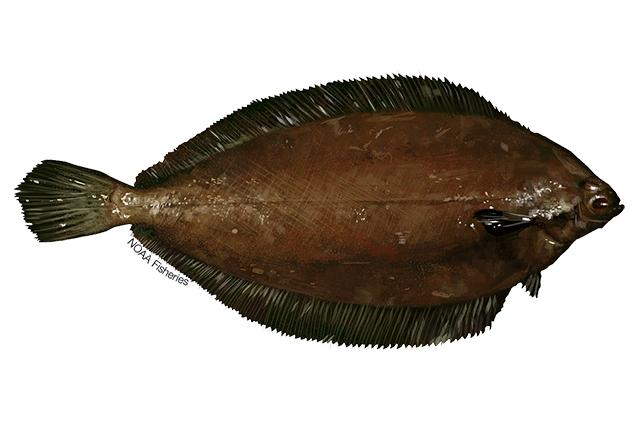
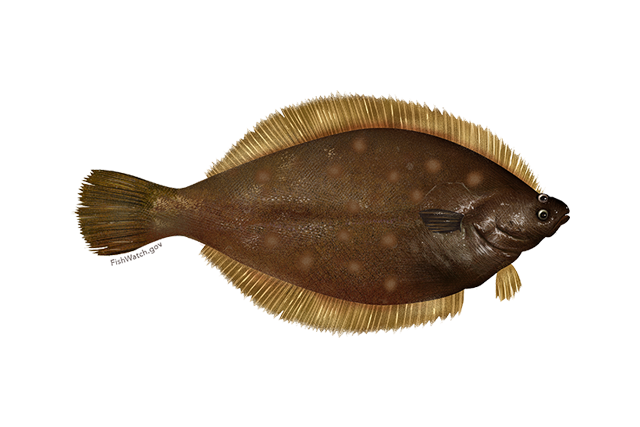
Winter Flounder
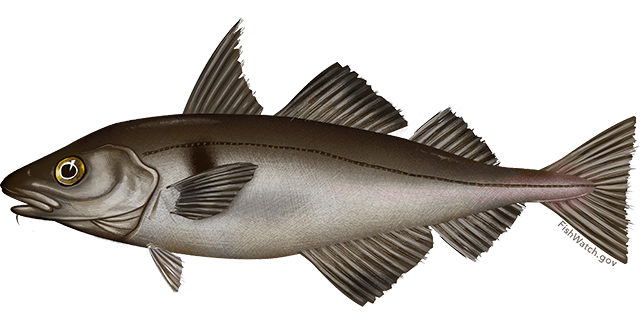
Haddock
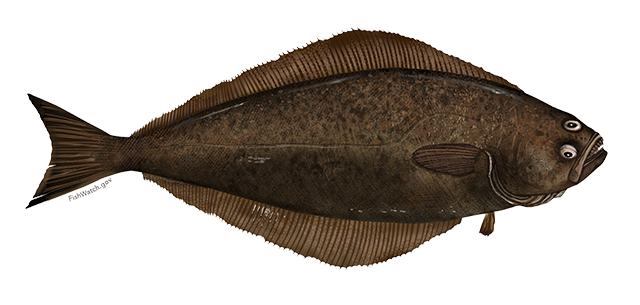
Atlantic Halibut
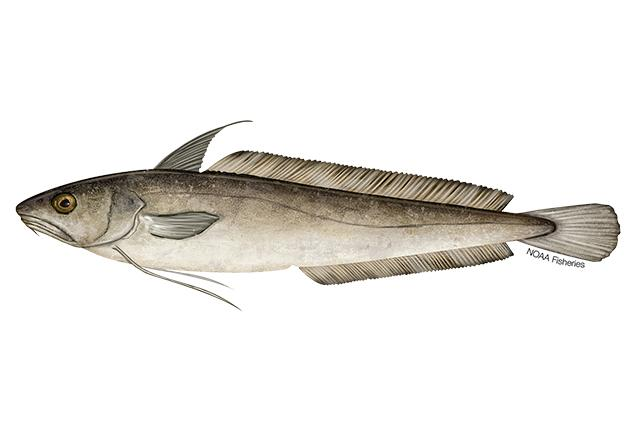
White Hake
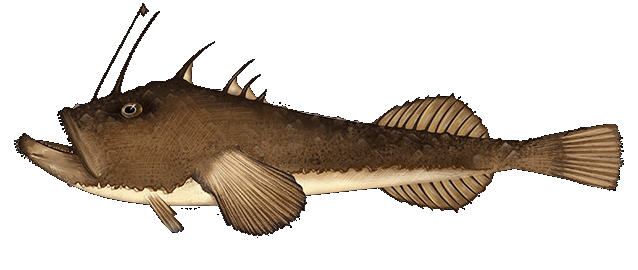
Monkfish
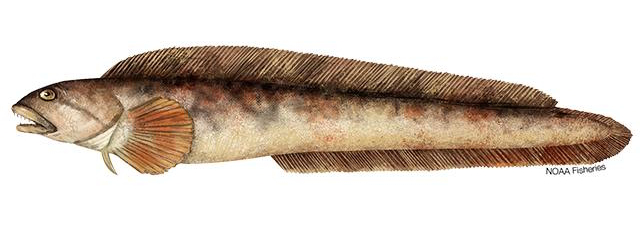
Ocean Pout
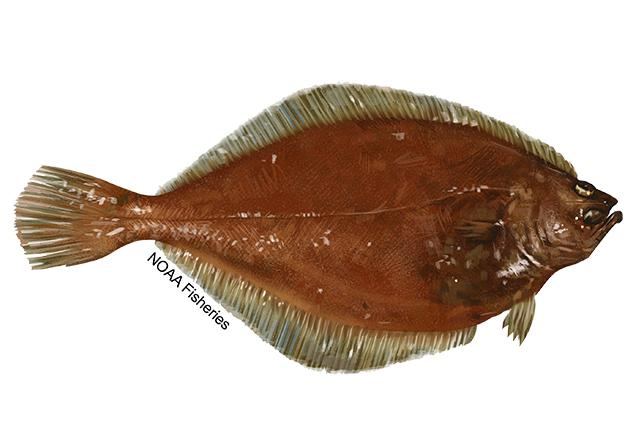
American Plaice
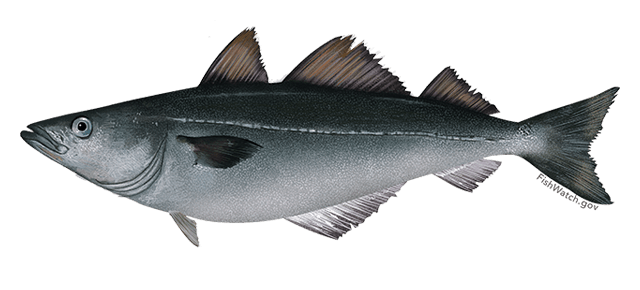
Atlantic Pollock
Witch Flounder
Yellowtail Flounder
Images fromNOAA Fisheries andFishWatch.gov .
Abbreviations for fish stocks reviewed
These are the abbreviations for fish stock names, as seen in the footers of each of the fish stock reports.
-
CATUNIT(Anarhichas lupus) Atlantic wolffish 19–27
-
FLWGB(Pseudopleuronectes americanus) winter flounder, from the Georges Bank 37–47
-
FLWGM(Pseudopleuronectes americanus) winter flounder, from the Gulf of Maine 28–36
-
HADGB(Melanogrammus aeglefinus) haddock, from the Georges Bank 48–58
-
HADGM(Melanogrammus aeglefinus) haddock, from the Gulf of Maine 59–70
-
HALUNIT(Hippoglossus hippoglossus) Atlantic halibut 71–79
-
HKWUNIT(Urophycis tenuis) white hake 80–91
-
MNKN(Lophius americanus) Northern monkfish 92–97
-
MNKS(Lophius americanus) Southern monkfish 98–103
-
OPTUNIT(Zoarces americanus) ocean pout 104–110
-
PLAUNIT(Hippoglossoides platessoides) American plaice 111–120
-
POKUNIT(Pollachius virens) pollock 121–133
-
WITUNIT(Glyptocephalus cynoglossus) witch flounder 134–141
-
YELCCGM(Limanda ferruginea) yellowtail flounder, from Cape Cod to Gulf of Maine 142–151
-
YELSNEMA(Limanda ferruginea) yellowtail flounder, from Southern New England to Mid-Atlantic 152–163
Statistical/review concepts, parameters, etc.
-
000sthousands 37, 38, 45, 48, 49, 56, 59, 60, 68, 80, 81, 89, 111, 112, 118, 121, 122, 131, 142, 143, 149, 152, 153, 161
-
5ZNAFO subdivision 5Z, having subareas 5Ze, 5Zej, etc. 73, 74
-
AAAnnual Allocation 7, 10–12, 113
-
ABCacceptable biological catch 7, 29, 94, 100
-
ACLannual catch limit 125
-
adaptsum-of-squares approach to fitting VPA models 37, 41
-
ageproAge-Structured Projection Model, software module 5, 127
-
ALKage-length-key 11, 12, 83, 144
-
A/Lage to length criterion 38, 39
-
ASAPAge-Structured Assessment Program, modelling software 5, 9–13, 59, 62, 63, 80–85, 121, 122, 125–127, 152, 155, 156
-
ASMAt Sea Monitoring 2
-
BLLSBottom Longline Survey 61, 63, 64, 83, 84
-
B MSYbiomass maximum sustainable yield 11, 28, 104
-
BRPbiological reference point 5, 10, 15, 63, 84, 106, 127, 146
-
BSIABest Scientific Information Available 32, 41, 53, 62, 74, 83, 95, 101, 115, 125, 156
-
B Terminalterminal year biomass 20
-
CAACatches-at-age 5, 12, 82–85, 126
-
CDFcumulative distribution function 38
-
CIconfidence interval 49
-
+cmcatch at least of specified length in centimeters 7, 28, 29, 31, 33
-
Covidrefers to coronavirus pandemic years, 2020–2021 2, 5–7, 9, 10, 12, 29, 39, 40, 72, 135, 143
-
CPUEcatch per unit effort 74
-
CVcoefficient of variation 62, 82, 85, 126
-
E Fullexploitation mortality on fully selected ages 28, 34
-
E MSYproxythe exploitation rate commensurate with fishing at the proxy for maximum sustainable yield 28, 29, 31, 34
-
E 40%exploitation rate at 40% of the total catch 28, 29, 31
-
F(instantaneous) fishing mortality rate 20, 29, 37–39, 41, 48–50, 52, 60, 61, 63, 67, 72, 81, 82, 92, 98, 105, 112, 113, 121–123, 126, 127, 130, 135, 143, 144, 152–154
-
F AVGaveraged fishing mortality 121–123, 130
-
F̅ 5:7average fishing mortality for fish aged 5 to 7 years 48–50, 55
-
F Fullfishing mortality rate on fully selected ages 19, 20, 24, 29, 37–39, 44, 59, 60, 80–82, 88, 93, 99, 105, 111, 112, 117, 135, 142–144, 148, 152–154, 160
-
flat selflat-topped survey selectivity 121–124, 126, 127, 129–131
-
F MSYfishing mortality rate for maximum sustainable yield 7, 20, 38, 64, 74, 94, 100, 104, 106, 122, 127
-
F MSYproxyproxy estimate of fishing mortality rate for maximum sustainable yield 19, 24, 37–39, 41, 44, 48, 49, 52, 55, 59, 60, 63, 67, 71, 80, 81, 84, 88, 92, 98, 104, 108, 111, 112, 114, 117, 121, 122, 130, 134, 142, 143, 148, 152, 153, 156, 160
-
F ρrho-adjusted value for the fishing rate 39, 50, 113, 123, 144, 154
-
F Targettheoretically ideal fishing mortality level for sustainability 44
-
F Thresholdthreshold fishing mortality level that indicates overfishing status 24, 34, 44, 55, 67, 88, 108, 117, 130, 148, 160
-
F 40%SPRfishing mortality for 40% of spawning potential rate 5, 19, 38, 49, 51, 52, 59, 60, 63, 64, 81, 112, 121, 122, 127, 143, 153
-
GMRFGaussian Markov random field 49–53
-
Ismoothrenaming of PlanBsmooth: a model using log-linear regression and Loess smoothing 92–95, 98–100
-
kg/towkilograms per tow 58, 104, 110
-
Loessloess curve fitting (local polynomial regression) xiii, xiv, 6, 12, 94, 100
-
log-normalprobability distribution whose logarithm is normally distributed 21, 27, 36, 58, 66–68, 70, 87–89, 91, 97, 103, 110, 116, 118, 120, 129–131, 133, 141, 159–161, 163
-
M(instantaneous) natural mortality rate 11, 63, 64
-
MCMCMarkov Chain Monte Carlo analysis 20, 21
-
ρMohn’s rho parameter: the average relative bias of retrospective estimates 20, 39, 48, 50, 60, 63, 66, 67, 80, 82, 85, 113, 123, 144, 154, 155
-
MSYmaximum sustainable yield 19, 28, 38, 49, 60, 71, 81, 92, 98, 104, 112, 122, 134, 143, 153
-
mtmetric ton 19, 28, 29, 31, 37, 38, 41, 43, 46, 48, 49, 52, 59, 60, 63, 64, 71, 74, 80, 81, 84, 85, 92, 98, 104, 111, 112, 114, 121–123, 125, 127, 134–137, 142, 143, 152–154, 156
-
NAnot applicable 28, 71, 92, 98, 134
-
NAANumbers-at-age 62
-
OFLoverfishing limit 7, 20, 29, 31, 81, 106
-
PlanBsmooth‘Plan B’ model using log-linear regression and Loess smoothing xiii, 9, 94, 100
-
qcatchability coefficient 28–32, 136, 155
-
Rexpected recruitment numbers 11
-
R MSYexpected recruitment when biomass is consistent with maximum sustainable yield 49
-
SBRMStandardized Bycatch Reporting Methodology 5, 83
-
scaleStatistical Catch at Length Model, software module 6, 19–21
-
scall drscallop dredge 37
-
SSBspawning stock biomass 5, 19, 20, 29, 37–39, 41, 48–52, 59–61, 63, 64, 66, 71, 80–82, 84, 85, 93, 99, 105, 111–113, 121–123, 126, 127, 135, 142–145, 152–155
-
SSB MSYspawning stock biomass consistent with maximum sustainable yield 19, 49, 60, 71, 74, 81, 92, 94, 98, 100, 104, 112, 122, 127, 134, 143, 153, 156
-
SSB MSYproxyproxy value for spawning stock biomass estimation for maximum sustainable yield 19, 23, 37, 38, 41, 43, 48, 52, 54, 59, 60, 63, 66, 80, 84, 87, 104, 106, 111, 114, 116, 121, 129, 142, 143, 146, 152, 159
-
SSB/SSB Thresholdratio of spawning stock biomass to spawning stock biomass threshold 5
-
SSB ρspawning stock biomass level adjusted according to Mohn’s rho 39, 50, 82, 113, 123, 144, 154
-
SSB Targettheoretically ideal spawning stock biomass level 23, 43, 54, 66, 87, 106, 116, 129, 145, 146, 159
-
SSB Thresholdthreshold for spawning stock biomass that indicates overfished status 23, 43, 54, 66, 87, 106, 116, 129, 145, 146, 159
-
VPAvirtual population analysis xii, 5, 7, 9, 10, 37, 38, 41, 49, 142–144
-
WAAWeight-at-age 52, 53, 61–64, 83, 85, 114, 156
-
Y ccatch years 37
Locations/regions: state, country, etc.
-
CACanada xv, 7, 37, 40, 71
-
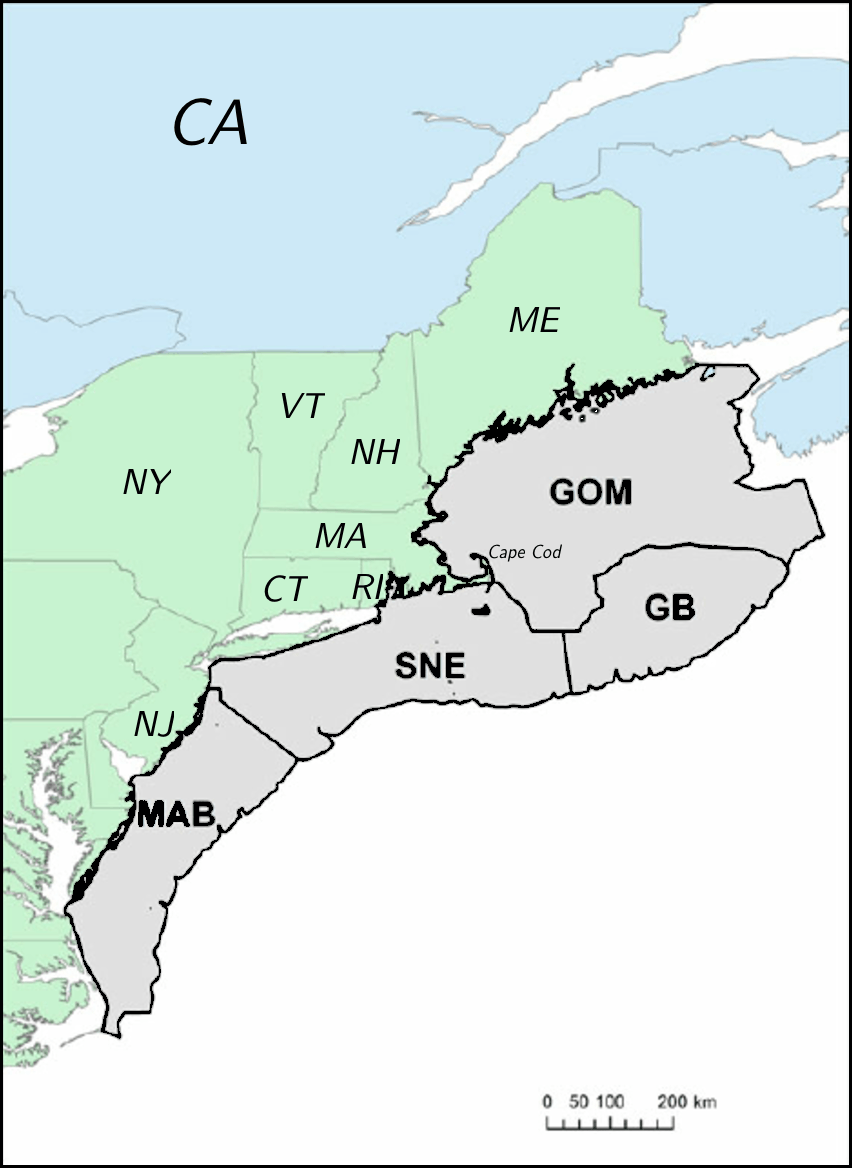
CCGMCape Cod to Gulf of Maine 5, 10, 145
-
CTConnecticut xv
-
GBGeorges Bank xv, 38
-
GOMGulf of Maine xv, 18, 63
-
MAMassachusetts III, x, xv, 17, 164
-
MABMid-Atlantic Bight xv
-
MEMaine xv
-
ME/NHMaine and New Hampshire 7, 10, 28, 31, 33, 34, 36, 85, 143
-
NHNew Hampshire xv
-
NJNew Jersey xv
-
NYNew York xv
-
RIRhode Island xv, 15, 17
-
SNESouthern New England xv
-
SNEMASouthern New England and Mid-Atlantic Bight 2, 3, 5, 11, 156
-
USUnited States 7, 8, 31, 37–39, 41, 42, 48, 51, 52, 57, 62, 72, 74, 83, 109, 126, 156, 157, 162
-
VAVirginia 1
-
VTVermont xv
1. 2022 MANAGEMENT TRACK PEER REVIEW PANEL REPORT
1.1. Executive Summary
Eleven fish stock assessments were reviewed by the September 2022 Management Track peer review panel. Eight of these were Level 2 Expedited Reviews: Gulf of Maine and Georges Bank winter flounder (Pseudopleuronectes americanus), Atlantic halibut (Hippoglossus hippoglossus), Georges Bank haddock (Melanogrammus aeglefinus), north and south monkfish (Lophius piscatorius), Southern New England/Mid-Atlantic yellowtail flounder (Limanda ferruginea), and American plaice (Hippoglossoides platessoides). The remaining three stocks received Level 3 Enhanced Review: white hake (Urophycis tenuis), Gulf of Maine haddock (Melanogrammus aeglefinus), and pollock (Pollachius virens). Levels of review were as recommended by the Assessment Oversight Panel Appendix A.
The Peer Review Panel (Panel) for the September 2022 Management Track Assessments met via webinar on September 19–22, 2022. The Panel was to determine whether the completed management track assessment was technically sufficient to (a) evaluate stock status, (b) provide scientific advice and (c) successfully address the assessment Terms of Reference Appendix B. Tables 1 and 2 present a list of the stocks, names of the lead analyst/presenters, and conclusions about stock status and the assessment.
Attendance at the meeting is provided in Appendix C with the Agenda shown in Appendix D.
We thank Russ Brown (Population Dynamics Branch Chief) and Michele Traver (Assessment Process Lead) for their support during the meeting and to the staff of the Population Dynamics Branch at NEFSC for the open and collaborative spirit with which they engaged the Panel. Dr. Brown’s presentation on Data Changes was especially appreciated.
Our thanks also extend to the rapporteurs for taking extensive notes during the meeting and to staff of the New England Fishery Management Council (NEFMC) or NOAA Fisheries Greater Atlantic Regional Fisheries Office (GARFO) who provided context and additional background.
The Panel has suggestions for improvements that should be made for future Management Track Assessments with respect to information needs:
- 1.
The SASINF portal is an incredible asset for these reviews, and we support its continued maintenance. It is not unusual for documents and data to change on the drive during the period of the review, and as such, it would be useful if a version control mechanism was implemented to allow the reviewers to be notified when changes are made to documents on the site.
- 2.
For transboundary stocks, it would be useful to have a presentation of the science and management for the Canadian fishery.
- 3.
For species with multiple stocks, consider providing an overview of stock status, structure, etc. at the beginning of the stocks’ presentations.
The Panel also has several cross-cutting recommendations with respect to the individual stock assessments:
- 1.
- 2.
The NEFSC Bottom Longline Survey should be continued and considered for incorporation in future stock specific Management Track assessments once the time-series has grown.
- 3.
- 4.
Reduction in Port sampling for individual lengths and age structures represents a significant threat to the stock assessment enterprise. NOAA should decide whether it can return Port sampling to levels comparable with those achieved prior to 2019. If they cannot, they should increase catch sampling by observers (either ASM or NEFOP) to balance the loss of these data.
- 5.
NOAA should continue to evaluate the use of dynamic reference points with analytic assessments.
- 6.
Assessments for stocks at very low abundance with low fishery mortality rates, showed sharp increases in abundance in projection years (e.g., Gulf of Maine winter flounder, SNEMA yellowtail flounder). This is a highly uncertain prediction because these increases may be an artifact of the model considering that low fishing mortality directly leads to increased abundance.
The Panel considered general data changes that were applied across assessments, including:
- 1.
adaptation to survey indices resulting from the missing 2020 research surveys due to the Covid-19 pandemic;
- 2.
- 3.
use of the Catch Accounting and Monitoring System ( CAMS) data for commercial landings for 2020 and 2021; and
- 4.
| Stock | Lead Analyst/Presenter | Peer review conclusion |
|---|---|---|
| Gulf of Maine winter flounder Expedited Review | Paul Nitschke | Stock’s overfished status is unknown but overfishing is not occurring |
| Georges Bank winter flounder Expedited Review | Alex Hansell | Stock is not overfished and overfishing is not occurring |
| Atlantic halibut Expedited Review | Dan Hennen | Stock status is unknown |
| Georges Bank haddock Expedited Review | Liz Brooks | Stock is not overfished and overfishing is not occurring |
| Monkfish – North Expedited Review | Jon Deroba | Stock status is unknown |
| Monkfish – South Expedited Review | Jon Deroba | Stock status is unknown |
| SNEMA yellowtail flounder Expedited Review | Chris Legault | Stock is overfished but overfishing is not occurring |
| American plaice | Larry Alade | Stock is not overfished and overfishing is not occurring |
| White hake Enhanced Review | Kathy Sosebee | Stock is not overfished and overfishing is not occurring |
| Gulf of Maine haddock Enhanced Review | Charles Perretti | Stock is not overfished and overfishing is occurring |
| Pollock Enhanced Review | Brian Linton | Stock is not overfished and overfishing is not occurring |
Appendix A. Summary of Assessment Oversight Panel Meetings for September 2022 Management Track Stock Assessments
The NRCC Assessment Oversight Panel (AOP) met to review the operational stock assessment plans for ocean pout, Atlantic wolffish, Georges Bank winter flounder, Gulf of Maine winter flounder, Cape Cod/Gulf of Maine yellowtail flounder, Southern New England/Mid-Atlantic yellowtail flounder, northern and southern monkfish, Georges Bank haddock, Gulf of Maine haddock, Atlantic halibut, witch flounder, white hake and pollock stocks on May 23–24, 2022. The AOP also met on August 3, 2022 to review the assessment plan for American Plaice, which underwent a Research Track peer review in July 2022. Four assessments were recommended for Level 1 Reviews (Direct Delivery) and these assessments will undergo an internal review before being delivered to the appropriate management body. The assessments for stocks/species recommended for Level 2 and 3 peer reviews will be reviewed during a meeting September 19–23, 2022.
The AOP consisted of:
Meeting Details:
These meetings were guided by the NRCC approved stock assessment guidance documents. Three background documents were provided to the Panel: (1) an updated prospectus for each stock; (2) an overview summary of all the salient data and model information for each stock; and (3) the NRCC Guidance memo on the Operational Assessments. Prior to the meeting, each assessment lead prepared a proposal for their Management Track Assessment. The proposal reflected the research track or most recent assessment results, the peer review panel Summary Report results and any initial investigations conducted for the management track assessment.
At the meeting, each assessment lead gave a presentation on the data to be used, model specifications (if applicable), evaluation of model performance, the process for updating the Biological Reference Points, the basis for catch projections, and an alternate assessment approach if their analytical assessment was rejected by the peer review panel.
Major Recommendations for Review of Individual Stocks:
In general, the AOP approved the plans presented, but recommended several points of emphasis to the recommended review levels as summarized below. AOP guidelines can be found in the stock assessment process document.
| Stock | Lead | Review Level | Rationale and Comments |
|---|---|---|---|
| Ocean Pout | Charles Adams | Level 1 Direct Delivery | Little impact of swept area adjustments on survey indices, low biomass could result in variable survey indices. Concern about the reliability of the discards. |
| Atlantic Wolffish | Charles Adams | Level 1 Direct Delivery | Little impact of swept area adjustments on survey indices, low biomass could result in variable survey indices; AOP requested that the longline survey indices be presented with the assessment; some concern length frequency data. |
| Georges Bank Winter Flounder | Alex Hansell | Level 2 Expedited Review | VPA assessment update with little change to the previous assessment, major retrospective pattern in previous assessment. |
| Gulf of Maine Winter Flounder | Paul Nitschke | Level 2 Expedited Review | Little change proposed to the assessment methods, little impact of the swept area adjustments on the NEFSC survey indices; missing survey in 2020 is problematic and the panel would recommend investigating other averaging approaches. |
| Atlantic Halibut | Dan Hennen | Level 2 Expedited Review | There was a large increase in the 2020 Canadian catch attributable to increased targeting by their longline fishery. We encourage investigation of the U.S. longline and any Canadian indices of abundance. There is sufficient investigation planned in the assessment methods to warrant a Level 2 review. |
| Witch Flounder | Susan Wigley | Level 1 Direct Delivery | Witch Flounder currently uses an empirical approach to provide management advice. The NEFSC bottom trawl surveys will be updated to include swept area adjusted abundance and biomass surveys. 2020 survey values missing due to Covid will be treated as missing in the application of the empirical approach. |
| Monkfish North | Jon Deroba | Level 2 Expedited Review | Revise discard estimation method from simple ratio to combined ratio method to make this consistent with SBRM and other stocks. No longer manually remove some ‘extreme’ discard observations. Make the stat areas that define each management area consistent among landing and discard calculations. Reconsider discard mortality assumption of scallop dredge based on Weissman et al. 2021. |
| Monkfish South | Jon Deroba | Level 2 Expedited Review | Revise discard estimation method from simple ratio to combined ratio method to make this consistent with SBRM and other stocks. No longer manually remove some “extreme" discard observations. Make the stat areas that define each management area consistent among landing and discard calculations. Reconsider discard mortality assumption of scallop dredge based on Weissman et al. 2021. |
| Georges Bank Haddock | Liz Brooks | Level 2 Expedited Review | Research Track completed earlier in 2022. Swept area adjustments to survey indices are within the confidence bounds of the survey estimates. Some changes to the projection methodology vs. the VPA based projections done in agepro. |
| Gulf of Maine Haddock | Charles Perretti | Level 3 Enhanced Review | The analyst plans to follow up on recommendations from the Research Track peer review to include the Bottom Longline Survey as a survey index and to develop a quantitative model that accounts for cohort strength to replace the averaging of Weights-at-Age over recent years in the projection approach. |
| CCGM Yellowtail Flounder | Larry Alade | Level 1 Direct Delivery | Scheduled for a Research Track assessment in 2024. One of the last remaining VPA. Few changes will be implemented. Missing survey data were evaluated and concerned about the retrospective. |
| SNEMA Yellowtail Flounder | Chris Legault | Level 2 Expedited Review | Scheduled for a Research Track assessment in 2024. Catch and survey indices are likely to remain very low. The analyst plans to explore fleet selectivity and other aspects to tune the ASAP model and explore cold pool indices relative to current recruitment to determine appropriate years to use projections. |
| White Hake | Kathy Sosebee | Level 3 Enhanced Review | Update all fishery and survey data through 2021. For 2020 CAA, use pooled Age Length Key as done for half 2 2003 since no survey age data. Potentially add ASMFC shrimp survey (include new age data) and bottom longline surveys either using spring and fall bottom trawl ages or direct ages. |
| Atlantic Pollock | Brian Linton | Level 3 Enhanced Review | Use new area swept-based NEFSC spring and fall survey indices. Evaluate use of a historical recreational catch series (1970–1980). Use current ASAP base and sensitivity model configurations. Evaluate new assessment starting year of 1981. Evaluate use of a single fishery fleet (commercial + recreational). Update base and sensitivity model BRPs using 2010 SAW 50 SSB/SSB Threshold, F40%SPR and SSB at F40%SPR projection approach. |
| American Plaice | Larry Alade | Level 2 Expedited Review | A Research Track stock assessment for American Plaice was peer reviewed in July 2022 (less than 3 weeks before the AOP meeting). New sources of data included 2020 and 2021 landings estimated through the Catch Assessment and Monitoring System (CAMS) and discards will be derived using CAMS generated landings and discard ratios generated using recent observer data. Projections will be done internally within WHAM, which will result in internally consistent input data. The alternative approach will be an ASAP type model (without random effects) that can be implemented within the WHAM framework. |
Individual Stock Discussion Summaries:
Ocean Pout (AOP Lead: Michael Wilberg)
Recommendation: Level 1 (Direct Delivery)
Ocean pout is assessed using the relative exploitation rate following the accepted assessment in the 2008 GARM, and its most recent status was overfished but overfishing not occurring. The assessment uses the catch divided by the 3-year moving average of the NEFSC Spring Trawl Survey. Catch is prohibited, so all catch is from discards. Projections are not done for this stock, and there is no alternate assessment approach. Recent years discards are estimated using the total CAMS catch and discard ratios from NEFOP. Recreational discards are not included as they are considered negligible. The survey indices had only very minor changes from the swept area adjustments. The stock appears to be at low biomass, which could result in variable survey indices.
The management track assessment will go through 2021. There are no proposed changes to analyses, but two data streams have changes in how they are calculated: the NEFSC Spring Trawl Survey Index and the discarded catch. These changes in processing the data streams are expected to have minor effects, but they could result in larger changes than anticipated. In particular, the lack of NEFOP sampling during part of 2020 has the potential to affect the estimate of discards. The direction and magnitude of that effect would depend on whether the period for which samples are not available is different from the rest of the period over which discards are calculated. Additionally, the 2020 NEFSC Spring Trawl Survey index is not available, and a two-year moving average will be used for the years impacted by that year. Therefore, the AOP recommends a Level 1 (Direct Delivery) review.
Atlantic Wolffish (AOP Lead: Lisa Kerr)
Recommendation: Level 1 (Direct Delivery)
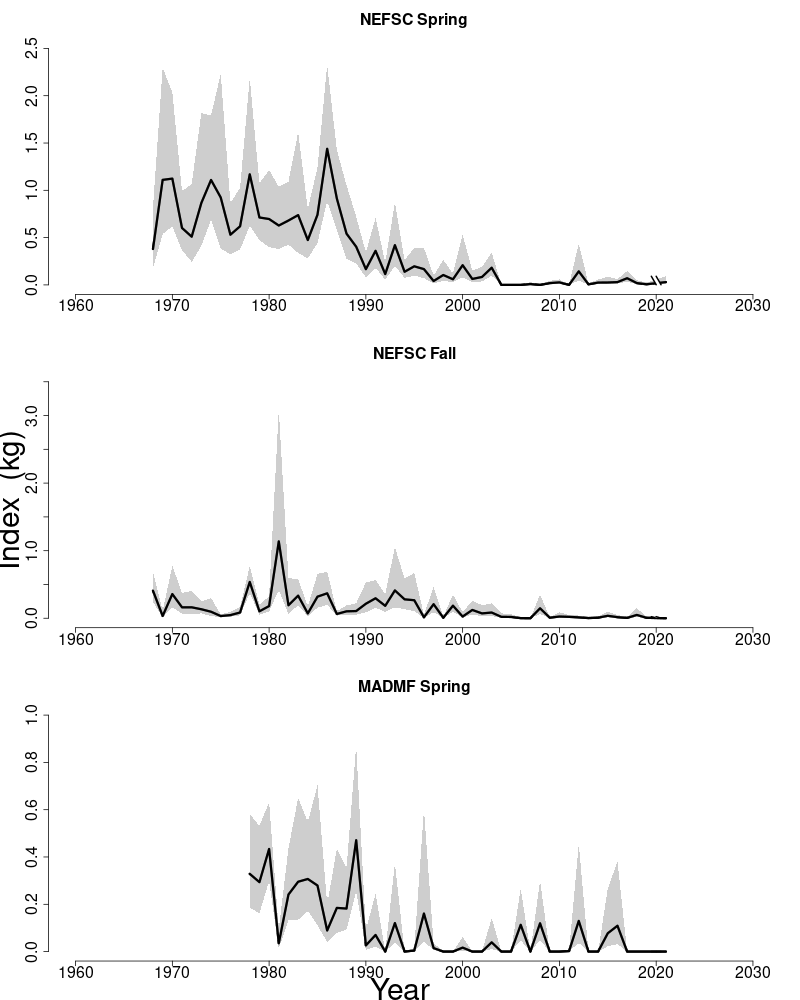
Wolffish is currently assessed using a forward projection model known as scale (Statistical Catch At Length) which tunes to size and age data from trawl survey recruitment and adult indices, total catch, and catch size distributions along with overall growth information. The model was approved by the 2008 Northeast Data Poor Stocks Working Group (NDPSWG) and last updated in 2020. The model features one fishery fleet with one selectivity block and four survey indices (NEFSC spring recruitment, and NEFSC fall and spring and MA DMF adult indices). The most recent stock status was overfished but overfishing is not occurring. In 2010, there was a change to a no possession limit for wolffish, so catch is from discards since that time. The NDPSWG deemed projections unreliable for this stock assessment and they are not conducted.
The management track assessment will update data for this stock through 2021. There are no proposed changes to the model, but two data streams (i.e., NEFSC Trawl Survey and the discarded catch) have changes in how they are calculated and Covid-19 disruptions resulted in missing surveys and reduced observer and port sampling of catch data in 2020. The NEFSC has adopted swept area biomass calculations of indices and the impact of the adjustment to the NEFSC trawl survey data was reported to be minimal for wolffish. The most recent years discards (2020 and 2021) will be estimated based on discard ratios calculated as usual based on observer data and the CAMS derived fleet landings. The missing 2020 surveydata will be treated as missing in the assessment (i.e., not imputed). The Panel expressed concern regarding the sufficiency of length frequency data in 2020 due to reduced observer coverage and how that could impact the assessment. The lead analyst noted that scale MRIP allows for missing length data and there are previous years with missing data. In addition, there is a general deficiency of data for this stock which would make it challenging to do much analytically about this issue. The interceptAOP suggested that Bottom Longline Survey indices for wolffish be provided along with the assessment. The backup assessment approach is a ‘Plan B’ Loesssmooth of NEFSC spring and fall adult indices. The uncertainty introduced by using ocean pout calibration and integration of newly published sex specific growth parameters were discussed but won’t be addressed in this management track due to time limitations. This management track assessment will update data through 2021 and include a new survey index as additional information for consideration outside of the assessment. The AOP recommended a Level 1 (Direct Delivery) review for wolffish with the opportunity for an update from the analyst on any identified data or model issues at the August AOP meeting.
Georges Bank Winter Flounder (AOP Lead: Gary Nelson)
Recommendation: Level 2 (Expedited Review)
The current assessment method for Georges Bank Winter Flounder is a VPA model that includes age-specific US and Canadian landings and discards, and age-specific trawl indices (NEFSC fall, NEFSC spring and CA DFO spring surveys). The proposed work for the 2022 Management Track assessment includes updating all landings, discards and the survey data, and performing OFL and ABC projections at FMSY for 2024–2026. The landings and discards will be updated via the CAMS system and the old NEFSC indices will be replaced with new NEFSC area-swept indices.
The AOP discussed the potential impact of the missing survey indices in 2020, data deficiencies with sampling and CAMS system estimates on the assessment. Comparisons between the new and old indices and between the 2019 AA and CAMS landings and discards were not provided, so members were uncomfortable concluding that the changes would have limited impacts on assessment results. In addition, the last VPA had a large retrospective bias and members expressed concern that low samples of data for characterizing catch-at-age could exacerbate the bias. Based on those concerns, the Panel elevated the assessment to a Level 2 (Expedited) review.
Gulf of Maine Winter Flounder (AOP Lead: Gary Nelson)
Recommendation: Level 2 (Expedited Review)
The current assessment method is an index-based approach that uses catch and estimates of 30+cm biomass from three non-overlapping fall trawl surveys (ME/NH, MA DMF, NEFSC). The proposed work for the 2022 Management Track assessment is to update the fall surveys and catch through 2021. The plan proposes to replace the NEFSC standardized trawl index with the new area-swept adjusted index. In addition, catch data will be assembled using the new CAMS automated system.
The AOP discussed three primary issues with the proposed assessment update. The AOP was concerned about the impact that Covid restrictions in 2020 had on sampling activities (e.g., sampling, observer coverage, etc.) from which estimates of landings and discards are made, and they wondered what biases could occur in the estimations. The AOP discussed the impact of the missing survey indices in 2020 on the calculation of catch advice because it is usually computed by using the average of two recent fall surveys; therefore, members worried about potential instability in the updated estimate using only one year (2021). Also, the AOP conferred that, although differences between NEFSC new area-swept index and the old index appear minor, some unanticipated changes in the results could occur. Based on those discussions, the Panel agreed to elevate this assessment to a Level 2 (Expedited) review.
Atlantic Halibut (AOP Lead: Paul Rago)
Recommendation: Level 2 (Expedited Review)
Atlantic halibut catches limits are based on an index method that combines trends in several measures of relative abundance to adjust recent catches on a regular basis. The method is known as the First and Second Derivative (FSD) method because it adjusts catches using a linear combination of the slope and rate of change in slopes of abundance indices. The catch in year t+ 1 is estimated as the product of the adjustment rate and the catch in year t. The abundance indices are the NEFSC fall bottom trawl survey and discard ratios for gillnet and trawl fleets in the Northeast. No biological reference points for Atlantic halibut in the US are available.
Application of the model in 2022 is complicated by a major change in the Canadian fishery in 2020. The total catch used in the original model includes catches in Canada from Stat Area 5. Shackell et al. (2021) reports the ongoing recovery of halibut but the recovery in Canadian waters may be occurring more quickly. Tagging analyses reported in Rago (2018) suggest regular movement of Atlantic halibut between US and Canada.
The sharp increase in landings in Canadian waters and declining indices in the US poses a dilemma for application of the current FSD model. Canada’s increase in landings is driven by results of a DFO assessment that increased the quota. This assessment is likely to have indices that are trending upward in contrast to US indices which appear to be either level or slightly decreasing. Nonetheless, the slightly lower FSD multiplier, when multiplied by the increased total catch, results in a large increase in potential US catch. The appropriateness of this calculation was discussed but not resolvable during the AOP meeting.
The Panel suggested that an investigation of the basis for the increase in Canadian landings would be useful. Comparisons of US index trends with Canadian indices of abundance might also be useful. The assessment lead will also investigate the applicability of the Cooperative Longline survey in the Gulf of Maine in the FSD model. The assessment lead also proposes to modify and align some of the Stat Areas with survey areas but does not plan to redefine stock areas. In view of the potential changes in the model framework and addition of a new index, the Panel recommended a Level 2 (Expedited) review for Atlantic halibut.
Witch Flounder (AOP Lead: Russell Brown)
Recommendation: Level 1 (Direct Delivery)
Witch Flounder currently uses an empirical approach to provide management advice. It is a unit stock, so is less dependent on CAMS approaches to allocate catch to separate stock areas. The NEFSC bottom trawl surveys will be updated to include swept area adjusted abundance and biomass surveys. 2020 survey values missing due to Covid will be treated as missing in the application of the empirical approach. It was noted that the age structure of the population continues to be truncated and the analyst will include supplement data in the data portal that is not directly used in the empirical analysis. The panel concluded that a Level 1 (Direct Delivery) review was warranted.
Northern and Southern Monkfish (AOP Lead: Gary Nelson)
Recommendation: Level 2 (Expedited Review)
The current assessment method for the northern and southern Monkfish stocks is the index-based method known as ‘PlanBsmooth’ that uses fishery landings and discards, and NEFSC fall, spring and summer survey indices. The proposed work for the 2022 Management Track assessment includes updating all landings, discards and the survey data through 2021 (the spring survey will be updated through 2022). The landings will be updated via the CAMS system and a new method for estimating discards will be examined. Also, the old NEFSC indices will be replaced with new NEFSC area-swept indices and methods for dealing with the missing 2020 survey values will be explored. Additionally, the discard mortality assumption of Monkfish in scallop dredges will be re-examined, how extreme discard observations are handled will be changed, and adjustments to statistical areas that define the managements will be made consistent.
The main discussion of the AOP pertained to the proposed exploration of imputing missing survey values. One member wondered what the potential outcome would be and suggested that including an additional year further back in time might help with stability of resulting catch advice. The analyst responded that, based on earlier simulations examining biases in the ‘PlanBsmooth’ method, catch advice should be fairly robust with a missing year, but he will try the suggested method. The AOP panel agreed that a Level 2 (Expedited) review is appropriate for the proposed changes.
Georges Bank Haddock (AOP Lead: Russell Brown)
Recommendation: Level 2 (Expedited Review)
A Research Track Assessment for Haddock was completed earlier in 2022. The assessment will be updated through 2021 and utilize a WHAM state space model to develop estimates of recruitment, biomass, and fishery mortality. In the Research Track, the working group and analyst demonstrated extensive bridge building from VPA to ASAP, and from ASAP to WHAM (Research Track TOR#4). The panel was concerned that this is one of the first implementations of WHAM, uncertainty about the change in the scale of the catch advice, and about reduced sampling in recent years. On this basis, the panel recommended a Level 2 (Expedited) review for this stock.
Gulf of Maine Haddock (AOP Lead: Russell Brown)
Recommendation: Level 3 (Enhanced Review)
A Research Track Assessment for Haddock was completed earlier in 2022. The assessment will be updated through 2021 and utilize an ASAP model to develop estimates of recruitment, biomass, and fishery mortality. The analyst plans to follow up on recommendations from the Research Track peer review to include the Bottom Longline Survey as a survey index and to develop a quantitative model that accounts for cohort strength to replace the averaging of Weights-at-Age over recent years in the projection approach. Based on these proposed changes to the assessment methodology the AOP concurred with the analyst recommendation that the management track update should receive a Level 3 (Enhanced) review.
Cape Cod/Gulf of Maine Yellowtail Flounder (AOP Lead: Lisa Kerr)
Recommendation: Level 1 (Direct Delivery)
Cape Cod/Gulf of Maine (CCGM) yellowtail flounder is assessed using a VPA that was approved in 2008 at GARM III and was last updated in 2019. The model includes a single fishery fleet and fall and spring time series from three fishery independent surveys (NEFSC, MA DMF, and ME/NH trawl surveys). This assessment has retrospective issues and adjustments were made to the model results. The most recent stock status is not overfished and overfishing is not occurring.
Two data streams (i.e., NEFSC trawl survey and landings) have changes in how they are calculated and Covid-19 disruptions resulted in missing surveys and reduced observer and port sampling of catch data in 2020. The NEFSC has adopted swept area biomass calculations of indices and the impact of the adjustment to the NEFSC trawl survey data is minimal for CCGM yellowtail flounder. The transition from AA tables to CAMS is not anticipated to have a significant impact based on a 2019 data comparison. The missing survey data will be treated as missing in the assessment (i.e., not imputed). An initial analysis of the impact of missing survey data on the performance of the VPA suggests the impact will be minimal.
This management track assessment will update all fishery and survey data through 2021 and use the current VPA model configuration with no changes. Projections will be calculated and BRPs will be updated using the prescribed approach without changes. The analyst will perform a comparison of population size between the cooperative research twin trawl catchability study and the VPA model estimates. The alternative assessment is an empirical approach which applies catchability estimates from the twin trawl study to expand survey catch/tow to absolute biomass from Bigelow Spring and Fall survey estimates. There are no major changes to the assessment model or the types of data incorporated in the model. The analyses of impacts of changes in data streams and missing data suggest that these will have minimal impact. The AOP recommended a Level 1 (Direct Delivery) review for CCGM yellowtail flounder with the opportunity for an update on any identified data or model issues at the August AOP meeting. The last management track assessment cited concerns about the uncertainty and retrospective patterns in this stock assessment. This is one of the last remaining assessments that applies the VPA approach and it is scheduled for a Research Track Stock Assessment in 2024. Major changes will be addressed at that time with a likely change in model type.
Southern New England/Mid-Atlantic Yellowtail Flounder (AOP Lead: Paul Rago)
Recommendation: Level 2 (Expedited Review)
The current assessment model for SNEMA yellowtail is based on an ASAP model, accepted in 2012 at SAW 54 and last updated in 2019. The model features an age dependent M, single fleet fishery, and three fishery independent surveys. Six selectivity blocks are used to model the stock from 1973 to 2018. The most recent selectivity block began in 2002. The stock is severely depleted, at about 10% of the 1/2 BMSY level, but overfishing is not occurring. Recruitment has been low and both reference points and projections are based on R estimates from 1990 onward.
The pandemic resulted in loss of both spring and fall bottom trawl surveys in 2020 and reductions in observer coverage. Funding issues reduced port sampling efforts. There are no recreational landings. Bottom trawl estimates will now use swept area per tow measurements to improve accuracy. Slight changes in overall means have been observed, but the variances of estimates tend to be large, overwhelming potential differences in scale. There does not seem to be any significant trend towards higher or lower values given adjustments for swept area. Landings estimates by stat area, previously based on the AA method, are expected to change only slightly as a result of the new CAMS approach. The new estimates of landings will not have any effects on estimates of discards but might be important in some instances in the future. Discard estimates are scaled by multiplying discard:kept ratios by total landings, which will change when CAMS rather than AA based estimates are used. The lead analyst has proposed to re-examine the selectivity blocks and other settings to improve model performance. The potential effects of swept area-adjusted survey indices will also be examined. Several recent publications in the literature have illustrated the utility of state-space models to estimate effects of environmental factors on stock dynamics. In particular, increases of the cold pool index (i.e., warmer) in the mid-Atlantic are associated with lower recruitment. These results cannot be directly included in the current model but they may be used to refine the range of years used to define ‘recent’ recruitment. Such a change, if justifiable, would alter both the biological reference points and abundance projections.
Given the potential effects of changes in selectivity blocks and the consideration of state space model results to inform the current assessment, the AOP recommended a Level 2 (Expedited) review for SNEMA yellowtail.
White Hake (AOP Lead: Lisa Kerr)
Recommendation: Level 3 (Enhanced Review)
White Hake is currently assessed using the ASAP model which was accepted in 2013 at SAW 56 and was last updated in 2019. The model extends back to 1963 and includes one fishery fleet with two selectivity blocks and two trawl survey indices (NEFSC fall and spring). Catch at age information is not well characterized for this stock due to possible misidentification of species in the commercial and observer data, particularly in early years, low sampling of commercial landings in some years, and sparse discard length data. Pooled age length keys (ALK) have been used during periods with deficient age data. The current status is overfished and overfishing is not occurring. This assessment has retrospective issues and adjustments were made to the model results.
Two data streams (i.e., NEFSC Trawl Survey and landings) have changes in how they are calculated and Covid-19 disruptions resulted in missing surveys and reduced observer and port sampling of catch data in 2020. The NEFSC has adopted swept area biomass calculations of indices and the impact of the adjustment to the NEFSC trawl survey data will be reported for white hake. The impact of the transition from AA tables to CAMS for white hake will be documented based on a 2019 data comparison. The missing survey data will be treated as missing in the assessment (i.e., not imputed) and a pooled ALK will be used for 2020 CAA for commercial landings.
The management track assessment will update all fishery and survey data through 2021. In addition, two new indices will be considered in the management track, the ASMFC shrimp survey and the Bottom Longline Survey. The current ASAP model configuration will be used with the additional indices. The analyst will explore the model sensitivity to use of pooled ALK. The biological reference points will be updated using approach prescribed through SAW 56 and projections will be performed assuming catch in 2022 is equal to the PDT provided 2022 landings. The alternative assessment plan is Loess smoothing of both NEFSC surveys indices to infer future catch increase. Age information as an important source of uncertainty for this stock. Ageing was completed for white hake from the shrimp survey, however, there is still a need for observer ages and from the bottom longline survey.
This management track assessment will involve substantial changes, including the potential addition of a new survey index. The AOP agreed with the analyst’s suggestion of a Level 3 (Enhanced) review for this stock.
Pollock (AOP Lead: Paul Rago)
Recommendation: Level 3 (Enhanced Review)
Pollock is currently assessed with an ASAP model that relies on dome shaped selectivity patterns for both the fishery and surveys. To ensure model convergence, the selectivity of oldest fish is fixed. The double dome model creates a “cryptic" biomass that cannot be estimated by survey data or captured by the commercial fishery.
Assessment scientists, managers, and even some harvesters have expressed concerns about the validity of the base (i.e., double-domed) model. An alternative model, which includes the same data but assumes a flat-top selectivity for survey indices, is used for comparison. Estimates of exploitable biomass from the base model compare favorably to the estimates from the sensitivity model (with a flat-top selectivity pattern for the survey).
The change from AA to CAMS appears to have little effect (0.1% increase) for 2019 comparison. Similarly, the use of a variable area per tow estimator appears to have little effect on the annual mean abundance estimates.
Commercial and recreational fisheries are modeled separately using data from 1970 to present. However, recreational catch before the start of the MRFSS program is assumed to be zero. To eliminate this inconsistency, a revised starting year of 1981 is proposed. The assessment lead also suggested pooling of recreational and commercial landings. This would eliminate the need to specify two selectivity patterns for these fleets. However, there may be some conflating of selectivity patterns because recreational catcheshistorically occurred inshore and on smaller fish (so called harbor pollock). The joint effects of changing the starting year, combining the recreational and commercial catches into a single fleet, and inherent instability of the base model are likely to require significant exploration of alternative model runs. After consideration of the number of changes, and their potential interactive effects, the Panel concurred with the lead scientist’s recommendation for a Level 3 (Enhanced) review.
American Plaice (AOP Lead: Russell Brown)
Recommendation: Level 2 (Expedited Review)
The Research Track stock assessment for American Plaice was peer reviewed in July 2022 (less than 3 weeks before the AOP meeting). A state space WHAM model informed by data through 2019 was tabled by the Management Track and accepted by the CIE peer review panel. New sources of data included 2020 and 2021 landings estimated through the Catch Assessment and Monitoring System (CAMS) and discards will be derived using CAMS generated landings and discard ratios generated using recent observer data. Model diagnostics for the assessment through 2019 were well behaved and the retrospective pattern was relatively insignificant (no retrospective adjustments are anticipated). Projections will be done internally within WHAM, which will result in internally consistent input data. The alternative approach will be an ASAP type model (without random effects) that can be implemented within the WHAM framework. As a result of these proposed changes, the AOP concurred that this assessment should receive a Level 2 (Expedited) review.
AOP Meeting Conclusions:
The AOP met on May 23–24, 2022 to review the stock assessment plans for 14 stocks and on August 3, 2022 for one stock scheduled for the September 2022 Management Track cycle. The panel concluded that Level 1 reviews (Direct Delivery) were warranted for ocean pout, Atlantic wolffish, witch flounder, and Cape Cod/Gulf of Maine yellowtail flounder; Level 2 reviews (Expedited Review) for Georges Bank winter flounder, Gulf of Maine winter flounder, Atlantic halibut, northern and southern monkfish, Georges Bank haddock, Southern New England/Mid-Atlantic yellowtail flounder and American Plaice; and Level 3 reviews (Enhanced Review) for Gulf of Maine haddock, white hake, and pollock. The Level 2 and 3 reviews will occur during the September 2022 Management Track Peer Review scheduled for September 19–22, 2022. Changes in the required review level would be triggered by a Northeast Fisheries Science Center request to increase the review level for a given stock. The AOP could concur to increase the review level via email or request to reconvene the AOP panel to have further discussions with the stock assessment lead. Any need to reconvene the panel would be a publicly announced meeting and any subsequent changes to the review level would be publicized to assessment partners and stakeholders.
Appendix A.1. Meeting participants
Panel, May 2022:
Attendees and Presenters, May 2022:
-
Cate O’Keefe – Fishery Applications Consultant
-
Christopher Maguire – Nature Conservancy
-
Gareth Lawson – Conservation Law Foundation
-
Maggie Raymond – Associated Fisheries of Maine
-
Melissa Sanderson – Cape Cod Commercial Fishermen’s Alliance
-
Peter Melanson – Protech AIS
-
Rebecca Peters – ME DMR
-
Tracey Bauer – ASMFC
Appendix B. Management Track Stock Assessment Terms of Reference
- 1.
Estimate catch from all sources including landings and discards.
- 2.
Evaluate indices used in the assessment (e.g., indices of relative or absolute abundance, recruitment, state surveys, age-length data, etc.).
- 3.
Estimate annual fishing mortality, recruitment and stock biomass (both total and spawning stock) as possible (depending on the assessment method) for the time series using the approved assessment method and estimate their uncertainty. Include retrospective analyses if possible (both historical and within-model) to allow a comparison with previous assessment results and projections, and to examine model fit.
- a.
Include bridge runs to sequentially document each change from the previously accepted model to the updated model proposed for this peer review.
- b.
Prepare a backup assessment approach that would serve as an alternative for providing scientific advice to management if the analytical assessment were to not pass review.
- a.
- 4.
Re-estimate or update the BRPs as defined by the management track level and recommend stock status. Also, provide qualitative descriptions of stock status based on simple indicators/metrics (e.g., age- and size-structure, temporal trends in population size or recruitment indices, etc.).
- 5.
Conduct short-term stock projections when appropriate.
- 6.
Respond to any review panel comments or SSC concerns from the most recent prior research or management track assessment.
Note: Major changes from the previous stock assessment require pre-approval by the Assessment Oversight Panel.
Appendix C. September 2022 Management Track Peer Review meeting attendees.
Panel, September 2022:
-
Richard Merrick – Chair
-
Matt Cieri – Panel
-
Cate O’Keefe – Panel
-
Yan Jiao – Panel
-
Michele Traver – NEFSC
Attendees and Presenters, September 2022:
-
Gareth Lawson – Conservation Law Foundation
-
Jackie O’Dell – Northeast Fisheries Coalition
-
Kris Vascotto – Atlantic Groundfish Council, Executive Director
-
Libby Etrie – Northeast Sector Service Network, Inc.
-
Yanjun Wang – DFO
Appendix D. Realized AgendaforSeptember2022 ManagementTrack peer review
| Time | Activity | Lead |
|---|---|---|
| Monday, September 19, 2022 | ||
| 9:00–9:15am | Welcome/Logistics/Conduct of Meeting | Michele Traver, Russ Brown, Richard Merrick, Chair |
| 9:15–10:00am | Input Data Changes Discussion/Questions | Russ Brown, Review Panel |
| 10:00–11:00am | GOM Winter flounder Discussion/Questions | Paul Nitschke, Review Panel |
| 11:00–11:15am | — Break — | |
| 11:15–12:15pm | George Bank winter flounder Discussion/Questions | Alex Hansell, Review Panel |
| 12:15–12:30pm | Discussion/Summary | Review Panel |
| 12:30–12:45pm | Public Comment | Public |
| 12:45–1:45pm | — Lunch — | |
| 1:45–2:45pm | Atlantic halibut Discussion/Questions | Dan Hennen, Review Panel |
| 2:45–3:45pm | Georges Bank haddock Discussion/Questions | Liz Brooks, Review Panel |
| 3:45–4:00pm | — Break — | |
| 4:00–4:15pm | Discussion/Summary | Review Panel |
| 4:15–4:30pm | Public Comment | Public |
| 4:30pm | — Adjourn — | |
| Tuesday, September 20, 2022 | ||
| 9:00–9:05am | Welcome/Logistics | Michele Traver, Richard Merrick, Chair |
| 9:05–10:30am | White hake | Kathy Sosebee |
| 10:30–10:45am | — Break — | |
| 10:45–12:00am | White hake cont. Discussion/Questions | Kathy Sosebee, Review Panel |
| 12:00–12:15pm | Discussion/Summary | Review Panel |
| 12:15–12:30pm | Public Comment | Public |
| 12:30–1:30pm | — Lunch — | |
| 1:30–3:30pm | Monkfish (North and South) Discussion/Questions | Jon Deroba, Review Panel |
| 3:30–3:45pm | — Break — | |
| 3:45–4:45pm | Southern New England/Mid-Atlantic yellowtail flounder Discussion/Questions | Chris Legault |
| 4:45–5:00pm | Discussion/Summary | Review Panel |
| 5:00–5:15pm | Public Comment | Public |
| 5:15pm | — Adjourn — | |
| Wednesday, September 21 | ||
| 9:00–9:05am | Welcome/Logistics | Michele Traver, Richard Merrick, Chair |
| 9:05–10:30am | Gulf of Maine haddock | Charles Perretti |
| 10:30–10:45am | — Break — | |
| 10:45–12:00pm | Gulf of Maine haddock cont. Discussion/Questions | Charles Perretti, Review Panel |
| 12:00–12:15pm | Discussion/Summary | Review Panel |
| 12:15–12:30pm | Public Comment | Public |
| 12:30–1:30pm | — Lunch — | |
| 1:30–3:30pm | Pollock | Brian Linton |
| 3:30–3:45pm | — Break — | |
| 3:45–4:45pm | Pollock cont. Discussion/Questions | Brian Linton |
| 4:45–5:00pm | Discussion/Summary | Review Panel |
| 5:00–5:15pm | Public Comment | Public |
| 5:15pm | — Adjourn — | |
| Thursday, September 22 | ||
| 9:30–11:00am | American plaice Discussion/Questions | Larry Alade |
| 11:00–11:15am | Discussion/Summary | Review Panel |
| 11:15–11:30am | Public Comment | Public |
| 11:30–12:00am | Key Points/Follow ups | Review Panel |
| 12:00–1:00pm | — Lunch — | |
| 1:00–5:00pm | Report Writing | Review Panel |
2. ATLANTIC WOLFFISH
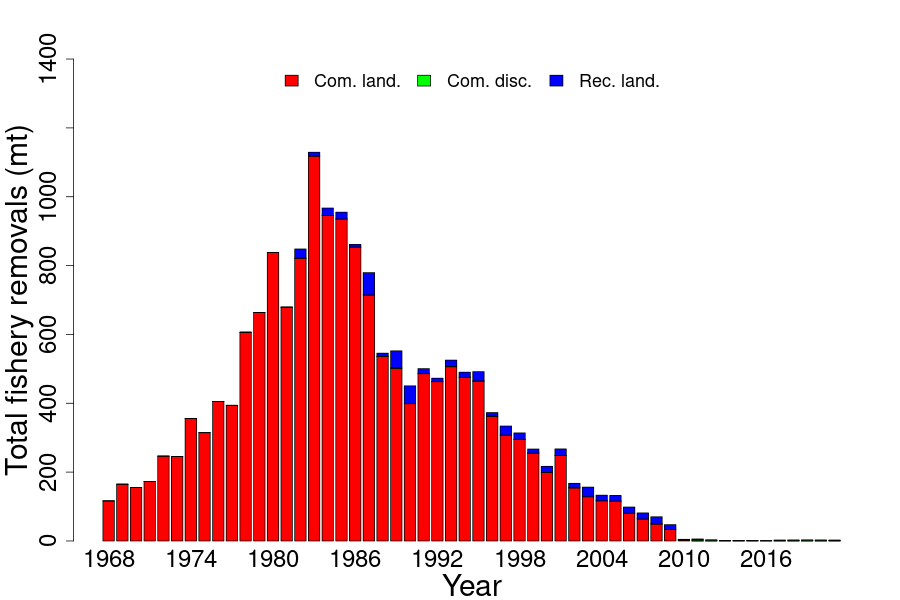
This assessment of the Atlantic wolffish (Anarhichas lupus) stock is a Level 1 management track assessment of the existing benchmark assessment (NDPSWG 2009). Based on the previous 2020 management track assessment (NEFSC 2022) the stock was overfished, but overfishing was not occurring. This assessment updates commercial fishery catch data, research survey indices of abundance, the analytical scale assessment model and reference points through 2021.
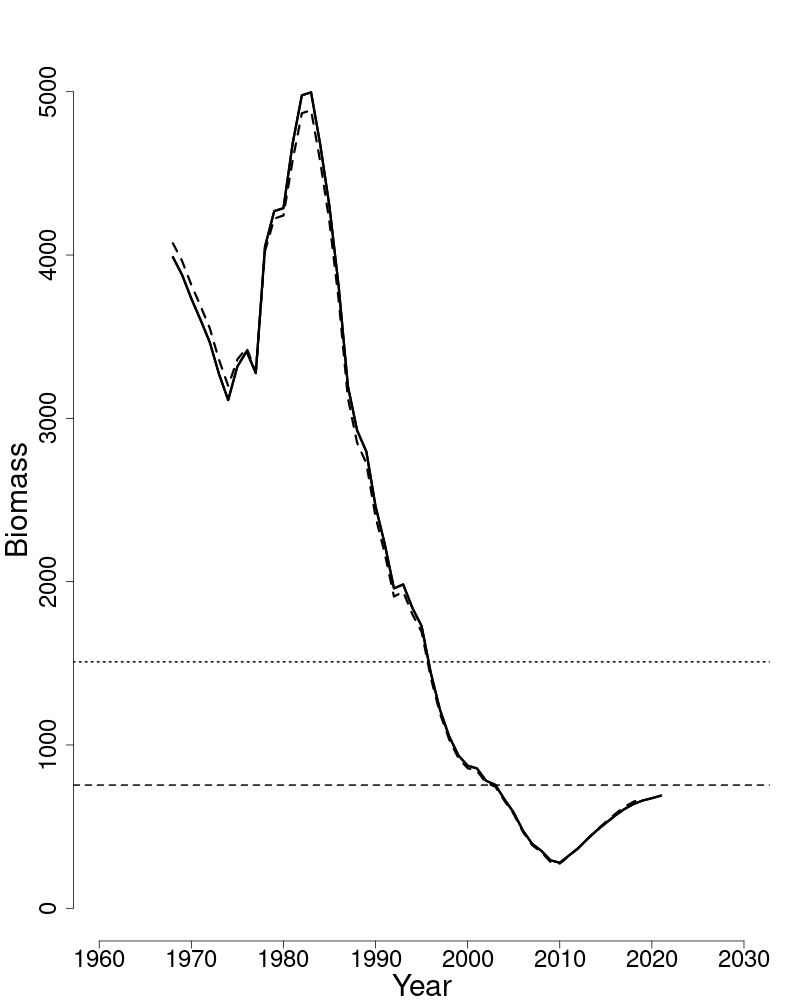
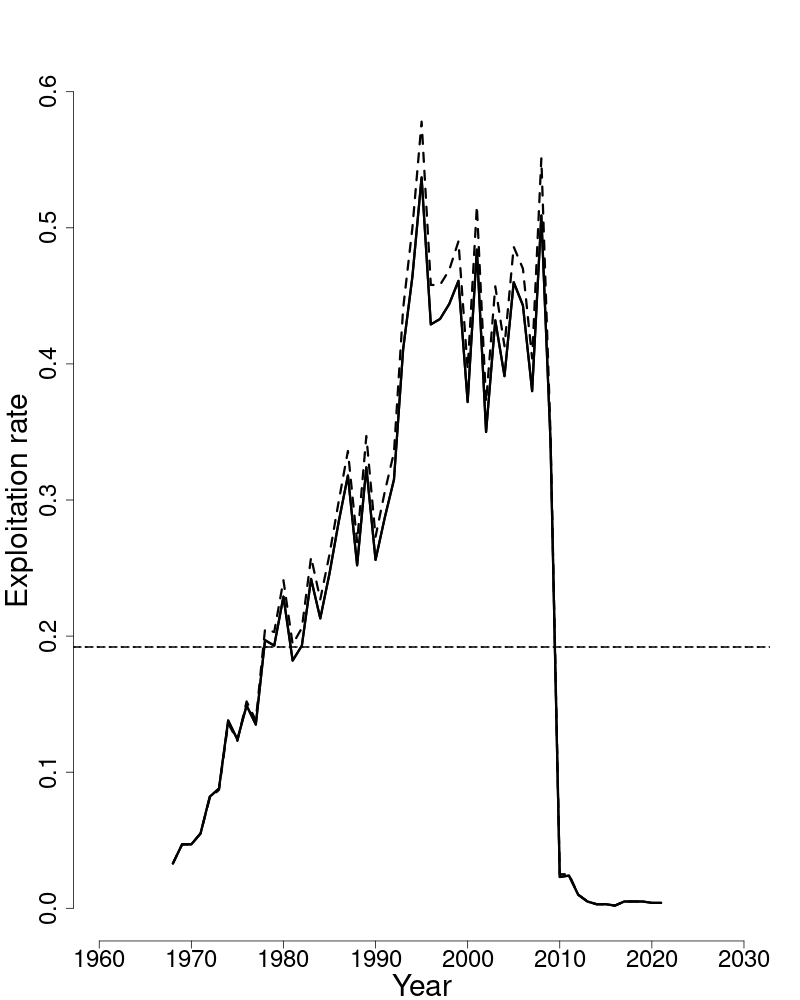
State of Stock: Based on this updated assessment, the Atlantic wolffish (Anarhichas lupus) stock is overfished and overfishing is not occurring (Figures 1–2). Retrospective adjustments were not made to the model results. Spawning stock biomass (SSB) in 2021 was estimated to be 690 (mt) which is 46% of the biomass target (SSBMSY proxy = 1,509; Figure 1). The 2021 fully selected fishing mortality was estimated to be 0.004 which is 2% of the overfishing threshold proxy (FMSY proxy= 0.192; Figure 2).
| 2012 | 2013 | 2014 | 2015 | 2016 | 2017 | 2018 | 2019 | 2020 | 2021 | |
|---|---|---|---|---|---|---|---|---|---|---|
| Data | ||||||||||
| Commercial landings | 0 | 0 | 0 | 0 | 0 | 0 | 0 | 0 | 0 | 0 |
| Commercial discards | 3 | 2 | 1 | 1 | 1 | 2 | 3 | 3 | 2 | 2 |
| Recreational landings | 0 | 0 | 0 | 0 | 0 | 0 | 0 | 0 | 0 | 0 |
| Catch for Assessment | 3 | 2 | 1 | 1 | 1 | 2 | 3 | 3 | 2 | 2 |
| Model Results | ||||||||||
| Spawning Stock Biomass | 368 | 424 | 476 | 522 | 567 | 607 | 638 | 660 | 674 | 690 |
| FFull | 0.01 | 0.005 | 0.003 | 0.003 | 0.002 | 0.005 | 0.005 | 0.005 | 0.004 | 0.004 |
| Recruits (age-1) | 50 | 45 | 39 | 56 | 96 | 138 | 273 | 274 | 274 | 274 |
| 2020 | 2022 | |
|---|---|---|
| FMSY proxy | 0.200 | 0.192 |
| SSBMSY (mt) | 1,543 | 1,509 |
| MSY (mt) | 218 | 211 |
| Median recruits (age-1) (millions) | 238 | 232 |
| Overfishing | No | No |
| Overfished | Yes | Yes |
Special Comments:
- •
What are the most important sources of uncertainty in this stock assessment? Explain, and describe qualitatively how they affect the assessment results (such as estimates of biomass, F, recruitment, and population projections).
The primary sources of uncertainty are the use of the ocean pout calibration coefficient (Atlantic wolffish coefficients are unknown), and the change to a no possession limit in May 2010. The ocean pout calibration coefficient (4.575) is one of the largest for any species (Miller et al. 2010), and results in lower biomass estimates. The change to a no possession limit places greater importance on discard mortality. Additionally, it is unclear whether the lack of a recruitment index since 2005 is due to an actual decrease in recruitment, or a change in catchability resulting from the increase in liner mesh size associated with the switch to the Bigelow. Other sources of uncertainty were identified in previous Atlantic wolffish assessments (NDPSWG 2009, NEFSC 2012): the surveys may have reached the limit of wolffish detectability due to the decline in abundance; and the lack of commercial length information results in model estimation difficulties for fishery selectivity.
- •
Does this assessment model have a retrospective pattern? If so, is the pattern minor, or major? (A major retrospective pattern occurs when the adjusted SSB or FFull lies outside of the approximate joint confidence region for SSB and FFull).
This assessment has retrospective patterns with Mohn’s ρ= 0.18 for SSB and −0.10 for F. However, confidence intervals are not available because MCMC is not fully developed for the scale model.
- •
Based on this stock assessment, are population projections well determined or uncertain? If this stock is in a rebuilding plan, how do the projections compare to the rebuilding schedule?
Due to the uncertainties in the assessment, the Northeast Data Poor Stocks Working Group (NDPSWG 2009) concluded that stock projections would be unreliable and should not be conducted. Catch advice is derived as OFL=FMSY×BTerminal using the terminal year exploitable biomass.
- •
Describe any changes that were made to the current stock assessment, beyond incorporating additional years of data and the effect these changes had on the assessment and stock status.
The time series of Bigelow indices was recalculated using station-specific swept areas. Supplemental Figure 26 (seeSASINF ) was presented to the Assessment Oversight Panel (AOP) on May 23, 2022; the AOP agreed that the differences were minor.The data source for commercial landings changed to the Catch Accounting and Monitoring System (CAMS) beginning in 2020. However, given the no possession limit, the AOP agreed that this is not an issue.
- •
If the stock status has changed a lot since the previous assessment, explain why this occurred.
Stock status has not changed since the previous assessment.
- •
Provide qualitative statements describing the condition of the stock that relate to stock status.
Catch has been limited almost exclusively to discards since the implementation of the no possession rule in May 2010. No age-1 recruits have been caught in the NEFSC spring survey since 2005.
- •
Indicate what data or studies are currently lacking and which would be needed most to improve this stock assessment in the future.
Several research needs were identified by the Peer Review Panel in the 2015 assessment (NEFSC 2015): potential use of a likelihood profile to apply the criterion for a retrospective adjustment; further studies on growth parameters; a tagging study to provide information on stock structure and movement; and a study of post-capture nest site fidelity.
- •
Are there other important issues?
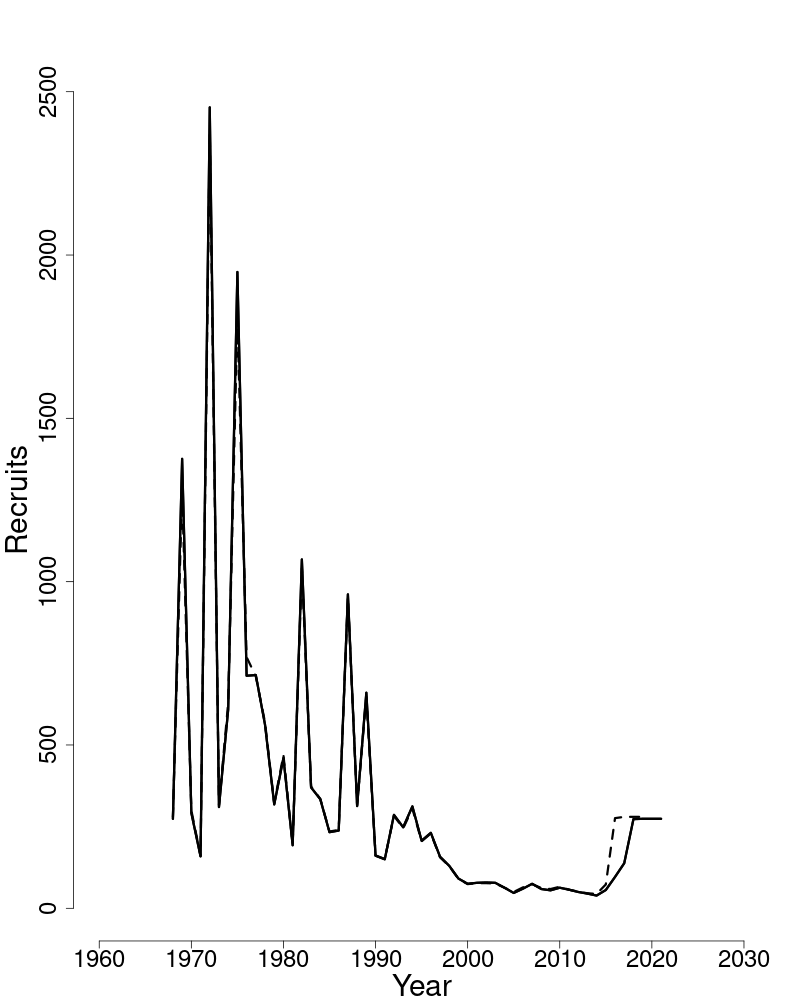
All 2020 surveys were treated as missing in the scale model. However, it should be noted that the scale model treats survey indices with zero catch as missing as well. For example, the NEFSC spring adult index had zero catch in 2004–2006, 2008 and 2011; thus, these years are treated as missing by the scale model.Recruitment at the end of the time series increases toward the initial recruitment estimate (Table 3; Figure 3) because there is no information in the model to inform these estimates. There is no indication in the data that recruitment has increased recently.Approximate 90% log-normal confidence intervals are not shown in Figures 1–3 because MCMC is not fully developed for the scale model.Discards estimates assume an 8% mortality rate based on Grant and Hiscock (2014). This results in very low removals under the no possession rule. Future model updates should see a population response from these low removals. However, if no change is observed in the data inputs (e.g., increased survey indices) then the diagnostics may worsen.Bottom long-line survey indices, which are not currently used in the scale model, are shown in supplemental Figure 27 (seeSASINF ) for informational purposes.
2.1. Reviewer Comments: Atlantic wolffish
Atlantic wolffish was not peer reviewed in fall of 2022.
References:
3. GULF OF MAINE WINTER FLOUNDER
This assessment of the Gulf of Maine winter flounder (Pseudopleuronectes americanus) stock is a Management Track assessment of the existing 2020 area-swept Management Track assessment (NEFSC 2022). Based on the previous assessment the biomass status is unknown but overfishing was not occurring. This assessment updates commercial and recreational fishery catch data, research survey indices of abundance, and the area-swept estimates of 30+cm biomass based on the fall NEFSC, MA DMF, and ME/NH surveys.
State of Stock: Based on this updated assessment, the Gulf of Maine winter flounder (Pseudopleu- ronectes americanus) stock biomass status is unknown and overfishing is not occurring (Figures 6–7). Retrospective adjustments were not made to the model results. Biomass (30+cm mt) in 2021 was estimated to be 5,093 mt (Figure 6). The 2021 30+cm exploitation rate was estimated to be 0.033 which is 14% of the overfishing exploitation threshold proxy (EMSY proxy= 0.23; Figure 7).
| 2016 | 2017 | 2018 | 2019 | 2020 | 2021 | |
|---|---|---|---|---|---|---|
| Data | ||||||
| Recreational discards | 11 | 5 | 2 | 2 | 1 | 1 |
| Recreational landings | 41 | 161 | 80 | 42 | 51 | 43 |
| Commercial discards | 3 | 3 | 3 | 4 | 2 | 6 |
| Commercial landings | 185 | 210 | 158 | 102 | 81 | 118 |
| Catch for Assessment | 240 | 378 | 243 | 150 | 134 | 168 |
| Model Results | ||||||
| 30+cm Biomass | 3,037 | 3,039 | 2,610 | 2,620 | NA | 5,093 |
| EFull | 0.079 | 0.124 | 0.093 | 0.057 | 0.033 | |
| 2020 | 2022 | |
|---|---|---|
| EMSY proxy | 0.23 | 0.23 |
| BMSY | Unknown | Unknown |
| MSY (mt) | Unknown | Unknown |
| Overfishing | No | No |
| Overfished | Unknown | Unknown |
Projections: Projections are not possible with area-swept based assessments. Catch advice was based on 75% of E40%(75%EMSY proxy) using the terminal year fall area-swept estimate assuming q= 0.81 on the wing spread which was updated using the average efficiency from 2009–2021 from the sweep experiment (Miller et al., 2017). Updated 2021 fall 30+cm area-swept biomass (5,093 mt) implies an OFL of 1,171 mt based on the EMSY proxy and a catch of 879 mt for 75% of the EMSY proxy. Catch advice (OFLs and ABCs) from the 2020 Management Track assessment was based on the average of the last two years of the fall surveys to make better use of the available new information and to help stabilize the catch advice. Alternatively, since the 2020 surveys are not available due to Covid, using the average of updated 2021 and 2022 spring and 2021 fall 30+cm area-swept biomass (4,660 mt) implies an OFL of 1,072 mt based on the EMSY proxy and a catch of 804 mt for 75% of the EMSY proxy.
Special Comments:
- •
What are the most important sources of uncertainty in this stock assessment? Explain, and describe qualitatively how they affect the assessment results (such as estimates of biomass, F, recruitment, and population projections).
The largest source of uncertainty with the direct estimates of stock biomass from survey area-swept estimates originates from the survey gear catchability (q). Biomass and exploitation rate estimates are sensitive to the survey q assumption. However this 2022 update does incorporate the use of a re-estimated q through an average estimate of efficiency from 2009–2021 fall and 2009–2022 spring (q= 0.81 fall and q= 0.70 spring) from the sweep study for the NEFSC survey. This updated q assumption (0.81) results in a lower estimate of 30+cm biomass (5,093 mt) relative to the 2020 estimate q= 0.71 assumption (5,783 mt) from the updated fall surveys. Another major source of uncertainty with this method is that biomass based reference points cannot be determined and overfished status is unknown.
- •
Does this assessment model have a retrospective pattern? If so, is the pattern minor, or major? (A major retrospective pattern occurs when the adjusted SSB or FFull lies outside of the approximate joint confidence region for SSB and FFull.)
The model used to determine status of this stock does not allow estimation of a retrospective pattern. An analytical stock assessment model does not exist for Gulf of Maine winter flounder. An analytical model was no longer used for stock status determination at SARC 52 (2011) due to concerns with a strong retrospective pattern. Models have difficulty with the apparent lack of a relationship between a large decrease in the catch with little change in the indices and age and/or size structure over time.
- •
Based on this stock assessment, are population projections well determined or uncertain? If this stock is in a rebuilding plan, how do the projections compare to the rebuilding schedule?
Population projections for Gulf of Maine winter flounder do not exist for area-swept assessments and stock biomass status is unknown. This stock was never declared as overfished. Catch advice from area-swept estimates tend to vary with inter-annual variability in the surveys. Consideration was given to using multiple surveys (fall 2021 and spring 2021–2022) to stabilize the biomass estimates and catch advice since 2020 surveys are not available due to Covid.
- •
Describe any changes that were made to the current stock assessment, beyond incorporating additional years of data and the effect these changes had on the assessment and stock status.
The assumption on q changed from 0.71 to 0.81 for the fall and from 0.62 to 0.70 for the spring using information from the updated average qs from the NEFSC survey (Miller et al., 2017) and incorporation of new survey data were made to this Gulf of Maine winter flounder Management Track assessment. The 2020 and 2021 commercial catch estimates are based on CAMS in this assessment. However, changes in total removals will not directly affect the estimated biomass or catch advice and total removals still remain far below the overfishing definition. In addition there were some minor changes to the survey indices due to tow based area-swept adjustments.
- •
If the stock status has changed a lot since the previous assessment, explain why this occurred.
The overfishing status of Gulf of Maine winter flounder has not changed.
- •
Provide qualitative statements describing the condition of the stock that relate to stock status.
The Gulf of Maine winter flounder has relatively flat survey indices with little change in the size structure over time. There have been large declines in the commercial and recreational removals since the 1980s. This large decline over the time series does not appear to have resulted in a response in the stock’s size structure within the catch and surveys nor has it resulted in a change in the survey indices of abundance. However, there have been increases in the fall 2021 and the spring 2021 and 2022 area swept biomass estimates. If increasing biomass trends continue then perhaps this is the beginning of a response to time series lows in exploitation rates.
- •
Indicate what data or studies are currently lacking and which would be needed most to improve this stock assessment in the future.
Direct area-swept assessments could be improved with additional studies on state survey gear efficiency. Quantifying the degree of herding between the doors and escapement under the footrope and/or above the headrope for state surveys is needed to improve the area-swept biomass estimates. Studies quantifying winter flounder abundance and distribution among habitat types and within estuaries could improve the biomass estimate.
- •
Are there other important issues?
The general lack of a response in survey indices and age/size structure are the primary sources of concern with catches remaining far below the overfishing level. Recent increases in the biomass could perhaps be the being of a response to removals being at record lows over the last three years (2019–2021). If recent increases in biomass is a response to the low catches then continuation of keeping catches near recent levels should result in further increases in biomass.
3.1. Reviewer Comments: Gulf of Maine winter flounder
The 2022 assessment of Gulf of Maine winter flounder (Pseudopleuronectes americanus) updates the 2020 area-swept Management Track assessment (NEFSC 2022)1010 NEFSC. 2022. Fall Management Track Assessments 2020., US Dept Commer, Northeast Fish Sci Cent Ref Doc. 22-08; 168p.CRD22-08. The analytic method was rejected in 2008 with GARM (2008) and again at SARC 52 (2011). Area swept assessments have been used since then. Updates were made of commercial and recreational fishery catch data, research survey indices of abundance, and the area-swept estimates of 30+cm biomass based on the fall NEFSC, Massachusetts Department of Marine Fisheries (MA DMF), and Maine/New Hampshire (ME/NH) surveys.
Retrospective adjustments were not made to the model results. A small change in q of the NEFSC surveys resulted from a recent paired tow efficiency study (Miller et al. in 2020)1111 Miller, T.J., D. Richardson, P. Politis, J. Blaylock, J. Manderson, and C. Roebuck. 2020. Relative efficiency of a chain sweep and the rockhopper sweep used for the NEFSC bottom trawl survey and biomass estimates for winter and windowpane flounder and red hake stocks. US Dept Commer, Northeast Fish Sci Cent Ref Doc. 20-XX; 31p.CRD20-XX which reduced the biomass estimate for much of the time series. Biomass (30+cm) in 2021 was estimated to be 5,093 mt.
The 2021 30+cm exploitation rate was estimated to be 0.033 which is 14% of the overfishing exploitation threshold proxy (EMSY proxy= 0.23).
Based on this updated assessment, the Gulf of Maine winter flounder stock’s overfished status is unknown but overfishing is not occurring.
Projections are not possible with area-swept based assessments. However, catch advice can still be provided, and as suggested by the AOP, the assessment scientist considered two approaches:
- •
One approach provided catch advice using a method like that used with the 2020 Operational Assessment, which averaged the last two years of the fall surveys to make better use of the available new information and to help stabilize the catch advice. Because the 2020 fall survey was not conducted, the updated 2021 and 2022 spring and 2021 fall 30 +cm area-swept biomass were averaged ( 4,660 mt ) which implies an OFL of 1,072 mt based on the EMSY proxy and a catch of 804 mt for 75% of the EMSY proxy.
- •
A second approach provided was to base the catch advice on 75% of E40% (75% EMSY proxy ) using the terminal year fall survey area-swept estimate, assuming q= 0.81 on the wing spread. The latter was updated using the average efficiency from 2009–2021 from the sweep experiment (Miller et al. 2020). Updated 2021 fall 30+cm area-swept biomass (5,093 mt ) implies an OFL of 1,171 mt based on the EMSY proxy and a catch of 879 mt for 75% of the EMSY proxy.
The Peer Review Panel (Panel) recommended that while the choice of approaches to providing catch advice does not have a major impact, it was the Panel’s consensus that averaging the 2 spring (2021 and 2022) and 1 fall (2021) surveys was the better choice for this assessment. Averaging reduces the noise resulting from ‘year’ effects (i.e., the balance between day and night tows, plus length effects in thedaytime tows). The protocol for the next (e.g., 2024) assessment will need to revisit this decision once multiple sequential fall surveys are available.
The Panel is concerned more about the uncertainty surrounding the rapid increase in catch advice given the stock’s depressed condition despite low fishing pressure. These historically low exploitation rates could be leading to the increased projected abundance seen in the most recent surveys, and an increase in effort could cap the stock’s nascent recovery.
Research suggestions:
- •
The Center should also consider statistical approaches that overcome the imbalance between day and night tows in a stratum.
- •
Consider applying year specific qs rather than averaging the full time series.
The Panel concluded that the 2022 assessment update for Gulf of Maine winter flounder fulfilled the recommendations of the AOP, is technically sufficient to partially evaluate stock status and provide scientific advice and meets the Terms of Reference for the stock’s assessment. The assessment represents Best Scientific Information Available (BSIA) for this stock for management purposes.
References:
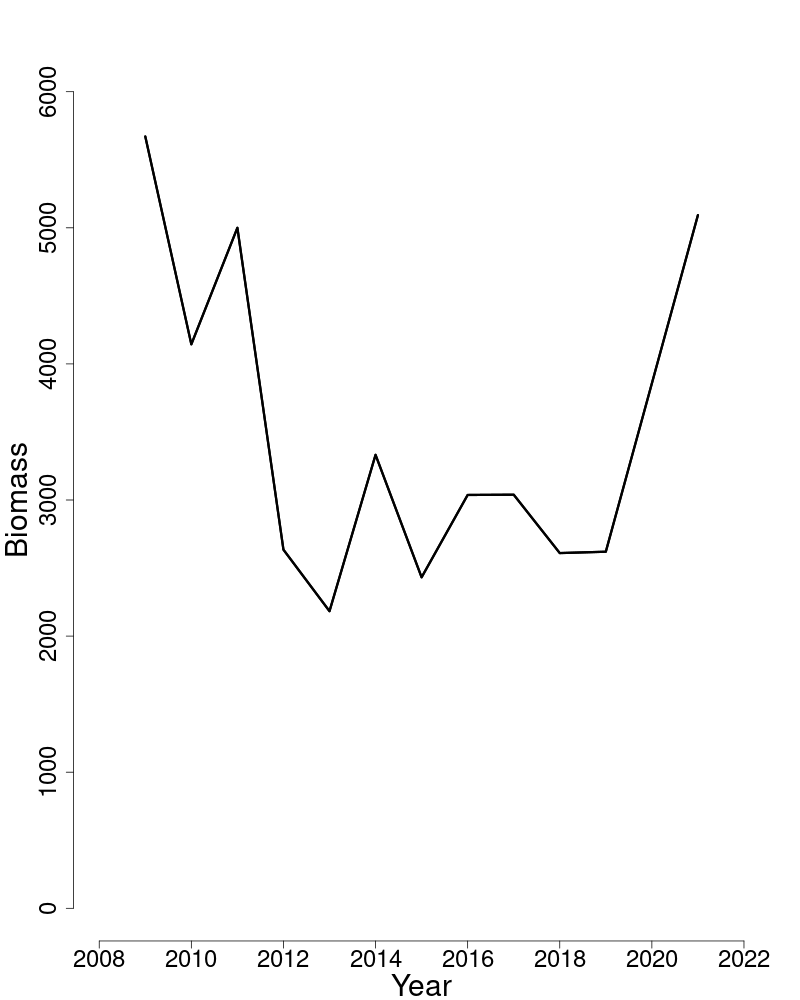
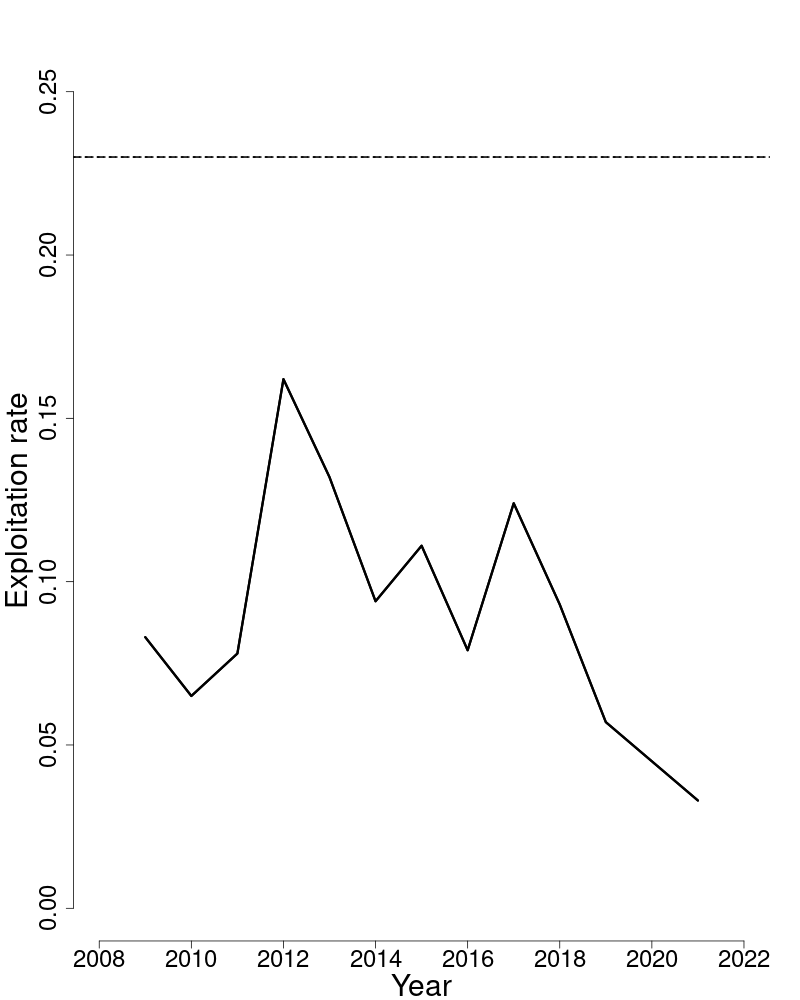
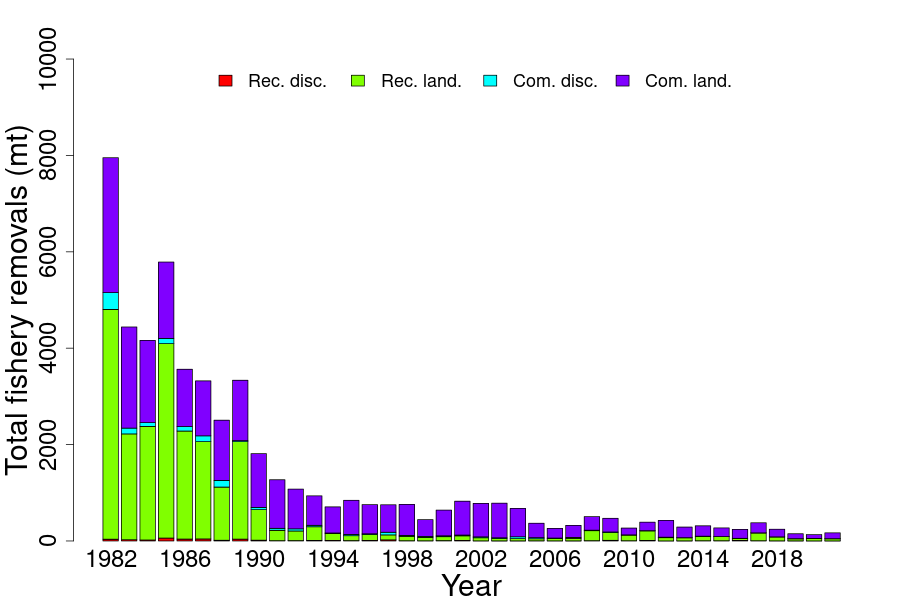
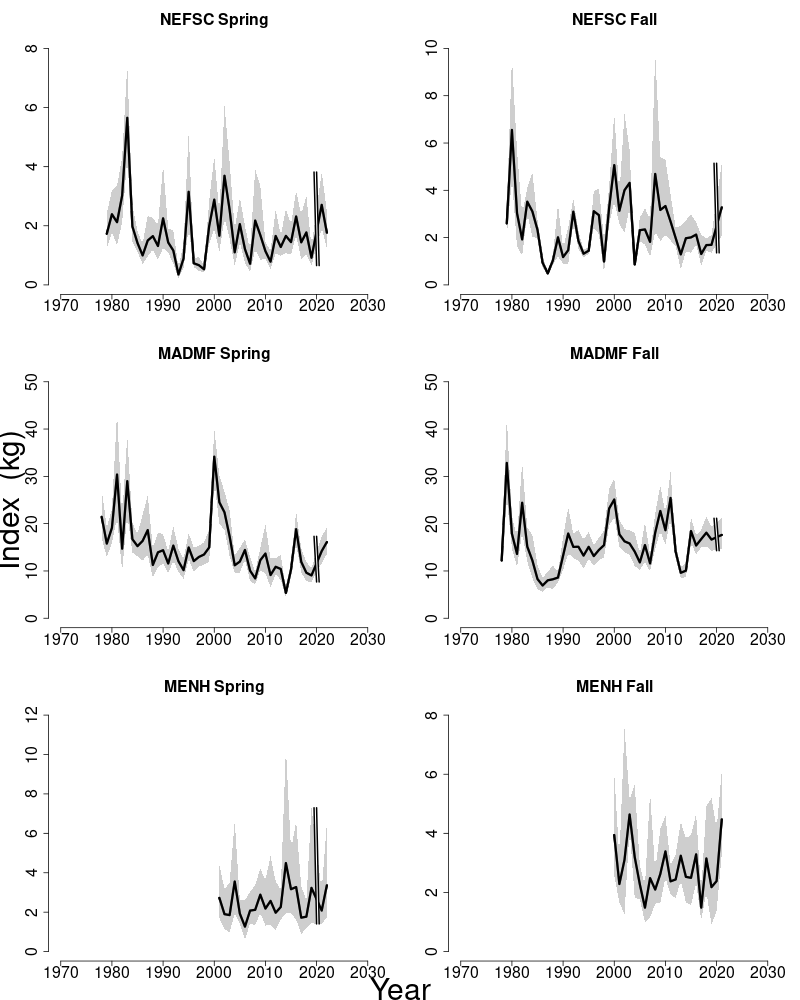
4. GEORGES BANK WINTER FLOUNDER
This assessment of the Georges Bank Winter Flounder (Pseudopleuronectes americanus) stock is a Management Track update of the existing 2020 operational VPA assessment which included data for 1982–2020 (NEFSC 2020). Based on the previous assessment the stock was overfished and overfishing was not occurring. This assessment updates commercial fishery catch data, research survey biomass indices, and the analytical VPA assessment model and reference points through 2021. Additionally, stock projections have been updated through 2025.
State of Stock: Based on this updated assessment, the Georges Bank Winter Flounder (Pseudopleu- ronectes americanus) stock is not overfished and overfishing is not occurring (Figures 10–11). Retrospective adjustments were made to the model results. Spawning stock biomass (SSB) in 2021 was estimated to be 7159 mt. The 2021 fully selected fishing mortality (F) was estimated to be 0.0485. However, the 2021 point estimate of SSB and F, when adjusted for retrospective error (59% for SSB and −36% for F), are outside the 90% confidence intervals of the unadjusted 2021 point estimates. Therefore, the values used in the stock status determination were the retrospective-adjusted values of F2021= 0.076 which is 16% of the overfishing threshold (FMSY proxy= 0.452; Figure 11), and SSB2021= 4,503 mt which is 60% of the biomass target (SSBMSY proxy= 7,503 with a threshold of 50% of SSBMSY proxy; Figure 10).
| 2012 | 2013 | 2014 | 2015 | 2016 | 2017 | 2018 | 2019 | 2020 | 2021 | |
|---|---|---|---|---|---|---|---|---|---|---|
| Data | ||||||||||
| US landings | 1,911 | 1,675 | 1,114 | 866 | 462 | 364 | 416 | 280 | 292 | 249 |
| CA landings | 83 | 12 | 12 | 13 | 4 | 6 | 9 | 11 | 7 | 6 |
| US discards | 126 | 46 | 46 | 19 | 5 | 14 | 41 | 20 | 49 | 6 |
| CA scall dr discards | 79 | 28 | 47 | 42 | 21 | 16 | 22 | 18 | 49 | 22 |
| Catch for Assessment | 2,199 | 1,761 | 1,219 | 940 | 492 | 400 | 488 | 329 | 397 | 283 |
| Model Results | ||||||||||
| Spawning Stock Biomass | 4,289 | 3,477 | 3,229 | 3,162 | 2,736 | 2,385 | 2,515 | 3,326 | 4,079 | 7,159 |
| FFull | 0.5404 | 0.5693 | 0.4899 | 0.2499 | 0.2015 | 0.1526 | 0.231 | 0.1412 | 0.0917 | 0.0485 |
| Recruits (age-1) | 3,366 | 2,409 | 2,863 | 1,322 | 3,034 | 3,495 | 5,617 | 4,940 | 10,740 | 8,920 |
Projections: Short-term projections of biomass were derived by sampling from a cumulative distribution function of recruitment estimates (1982–2020 Yc) from the final run of the adapt VPA model. The annual fishery selectivity, maturity ogive (a 3-year moving window), and mean weights-at-age used in the projection are the most recent five-year averages (2017–2021). An SSB retrospective adjustment factor of 0.629 was applied in the projections.
| 2020 | 2022 | |
|---|---|---|
| FMSY proxy | 0.358 | 0.452 |
| SSBMSY proxy (mt) | 7,267 (4,143–11,113) | 7,503 (4,790–10,705) |
| MSY (mt) | 2,573 (1,520–3,835) | 2,757 (1,811–3,918) |
| Median recruits (age-1) (000s) | 8,470 | 8,759 |
| Overfishing | No | No |
| Overfished | Yes | No |
| Year | Catch (mt) | SSB (mt) | FFull |
|---|---|---|---|
| 2022 | 278 | 5,755 (4,427–7,445) | 0.058 |
| Year | Catch (mt) | SSB (mt) | FFull |
| 2023 | 2,360 | 6,322 (4,651–8,890) | 0.452 |
| 2024 | 1,963 | 4,738 (3,053–5,247) | 0.452 |
| 2025 | 1,819 | 5,236 (3,467–7,957) | 0.452 |
Special Comments:
- •
What are the most important sources of uncertainty in this stock assessment? Explain, and describe qualitatively how they affect the assessment results (such as estimates of biomass, F, recruitment, and population projections).
The largest source of uncertainty is probably the estimate of natural mortality, which is based on longevity (max. age = 20). Natural mortality is not well studied in Georges Bank Winter Flounder and is assumed to be constant over time. Natural mortality affects the scale of the biomass and fishing mortality estimates.
VPA assumes catch is known without error, which in the case of Georges Bank Winter Flounder is certainly not true. Discards from the Canadian bottom trawl fleet were not provided by DFO and the precision of the Canadian scallop dredge discard estimates are uncertain. In addition, there are no length or age composition data for the Canadian landings or discards of GB winter flounder. The lack of age data for the Canadian spring survey catches requires the use of the US spring survey A/L keys for several disparate data streams, including the Canadian scallop discards, US otter trawl and scallop discards, despite selectivity differences. Various other gaps in catch data at age or length have been filled using decisions based on expert opinion and are difficult, if not impossible, to reproduce. Different decisions produce different model inputs and result in differentoutcomes. The direction and magnitude of the bias associated with filling gaps using expert opinion is unknown, but likely common in VPA assessments.
Another potentially important uncertainty is the lack of 2020 NEFSC fall and spring surveys. For 2022, DFO survey estimates were not available due to the use of a new survey vessel and an absence of a calibration factor.
- •
Does this assessment model have a retrospective pattern? If so, is the pattern minor, or major? (A major retrospective pattern occurs when the adjusted SSB or FFull lies outside of the 90% confidence intervals for SSB and FFull.)
The 7-year Mohn’s ρ, relative to SSB, was 0.57 in the 2020 assessment and was 0.59 in 2021. The 7-year Mohn’s ρ, relative to F, was −0.34 in the 2020 assessment and was −0.36 in 2021. There was a major retrospective pattern for this assessment because the ρ-adjusted estimates of 2021 SSB (SSBρ= 4,503) and 2021 F (Fρ= 0.076) were outside the 90% confidence limits for SSB (6,871–11,642) and F (0.03–0.049). A retrospective adjustment was made for both the determination of stock status and for projections. The retrospective adjustment changed the 2021 SSB from 7,159 to 4,503 and the 2021 FFull from 0.0485 to 0.076.
- •
Based on this stock assessment, are population projections well determined or uncertain? If this stock is in a rebuilding plan, how do the projections compare to the rebuilding schedule?
Population projections for Georges Bank Winter Flounder are uncertain because confidence bounds for projected biomass estimates from the previous assessment did not capture the terminal estimate of biomass from this one. This stock was required to be rebuilt by 2017, but this did not occur. The stock is in a revised rebuilding plan, based on fishing at 70% of FMSY proxy, with rebuilding by 2029.
- •
Describe any changes that were made to the current stock assessment, beyond incorporating additional years of data and the affect these changes had on the assessment and stock status.
Changes made to the Georges Bank Winter Flounder assessment included updating the most recent 5-year averages (2017–2021) of fishery selectivity-, proportion mature-, stock weights-, catch weights-, and spawning stock weights-at-age.
US spring and fall indices were revised from 2009 to 2022 to account for tow-specific area swept; revised indices were similar to previous relative abundance estimates. The new US commercial fishery data processing system (Catch Accounting and Monitoring System [CAMS]) was used to produce US landings estimates for 2020 and 2021. In 2021, age samples were not available for US landings so the A/L key from the 2020 landings were used to produce estimates for 2021. The Covid epidemic caused the cancelation of the 2020 NEFSC spring and fall surveys. DFO survey results were not available for 2022 because of a change in vessel. The missing NEFSC surveys appear to have had a minor effect; however, the absence of the DFO survey most likely increased SSB estimates. The DFO survey results will be available once a calibration study occurs (see GBFLWupdate2022Extras.pdf available atSASINF for discussion of sensitivity testing on this and other potential issues).
- •
If the stock status has changed a lot since the previous assessment, explain why this occurred.
The stock status of Georges Bank Winter Flounder has changed from ‘overfished and overfishing is not occurring’ to ‘not overfished and overfishing is not occurring’.
- •
Provide qualitative statements describing the condition of the stock that relate to stock status.
The ‘Plan B’ assessment results (available atSASINF ) indicate that biomass has increased since 2019. There are indications of improvement in stock condition. Catch weight-at-age has been increasing for the last few years and there are indications of a better than average recruitment class in 2020 in the CA spring survey.
- •
Indicate what data or studies are currently lacking and which would be needed most to improve this stock assessment in the future.
The Georges Bank Winter Flounder assessment could be improved with a shift to a model that incorporates statistical fits to commercial length and age composition and deprecates the requirement that catch be known without error.
- •
Are there other important issues?
2020 commercial data, in addition to survey data, was likely affected by the Covid-19 outbreak. Commercial vessels may have carried fewer observers and fished fewer days. The lack of consistency in commercial data may reduce the precision and accuracy of the Georges Bank Winter Flounder assessment in the near term.
4.1. Reviewer Comments: Georges Bank Winter Flounder
The 2022 assessment of Georges Bank winter flounder (Pseudopleuronectes americanus) updates the 2020 operational adapt-VPA assessment that included data for 1982–2019 (NEFSC 2020)1212 NEFSC. 2022. Operational Assessment of 14 Northeast Groundfish Stocks Updated Through 2018. US Dep Commer, NOAA Fisheries, Northeast Fish Sci Cent Ref Doc. 22-06; 227p.CRD22-06. This assessment updates commercial fishery catch data, research survey biomass indices, and the analytical VPA assessment model and reference points through 2021. Additionally, stock projections have been updated through 2025. Note that the stock is in a revised rebuilding plan, based on fishing at 70% of FMSY proxy, with rebuilding by 2029.
Unadjusted spawning stock biomass (SSB) in 2021 was estimated to be 7,159mt and the 2021 fully selected fishing mortality (F) was estimated to be 0.049. However, the 2021 point estimate of SSB and F, when adjusted for retrospective error (0.59% for SSB and −0.36% for F), are outside the 90% confidence intervals of the unadjusted 2021 point estimates. Therefore, the values used in the stock status determination were the retrospective-adjusted values of F2021= 0.076 which is 17% of the 2022 overfishing threshold (FMSY proxy= 0.452), and SSB2021= 4,503 mt which is 60% of the biomass target for an overfished stock (2022 SSBMSY proxy= 7,503 with a threshold of 50% of SSBMSY proxy).
Based on this updated assessment, the Georges Bank winter flounder stock is not overfished and overfishing is not occurring.
Short-term projections of biomass were derived by sampling from a cumulative distribution function of recruitment estimates (1982–2020 year class) from the final run of the adapt-VPA model. The annual fishery selectivity, maturity ogive (a 3-year moving window), and mean weights-at-age used in the projection are the most recent five-year averages (2017–2021). An SSB retrospective adjustment factor of 0.629 was applied in the projections.
The estimated catch for 2022 is 278 mt, which results in catch advice of 2360, 1963 and 1819 mt for 2023–2025 respectively.
Though the estimates of retrospective pattern have declined (at least for SSB), the Panel noted the persistence of retrospective bias in this assessment. This could be an artifact of the VPA model, and an evaluation of retrospective patterns in the winter flounder stocks could be insightful. Ultimately, the Panel could see no utility in going to an index-based approach and recommended the VPA model be accepted as is.
Recommendations:
- •
Consider using change point analysis to identify recruitment stanzas.
- •
Consider statistical catch at age model in next Research Track.
The Panel concluded that the 2022 assessment update for Georges Bank winter flounder fulfilled the recommendations of the AOP, is technically sufficient to evaluate stock status and provide scientific advice and meets the Terms of Reference for the stock’s assessment. The assessment represents Best Scientific Information Available (BSIA) for this stock for management purposes.
References:
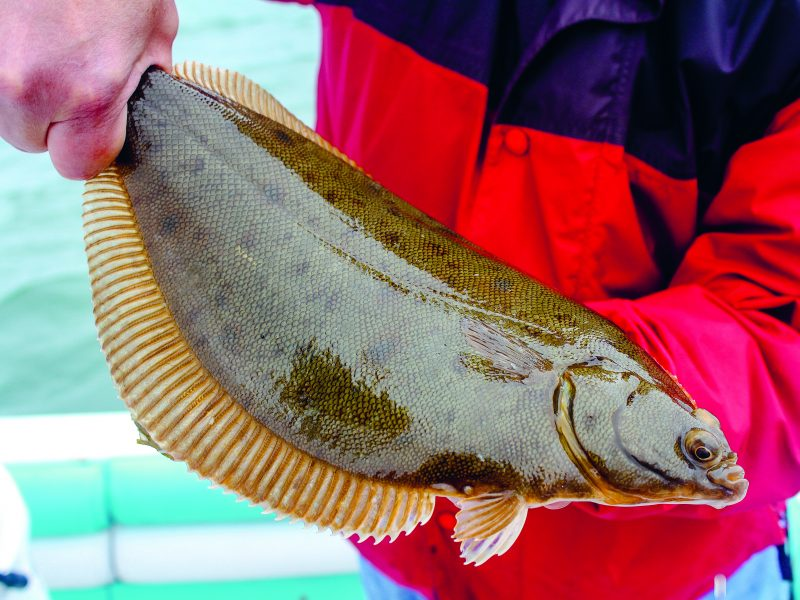
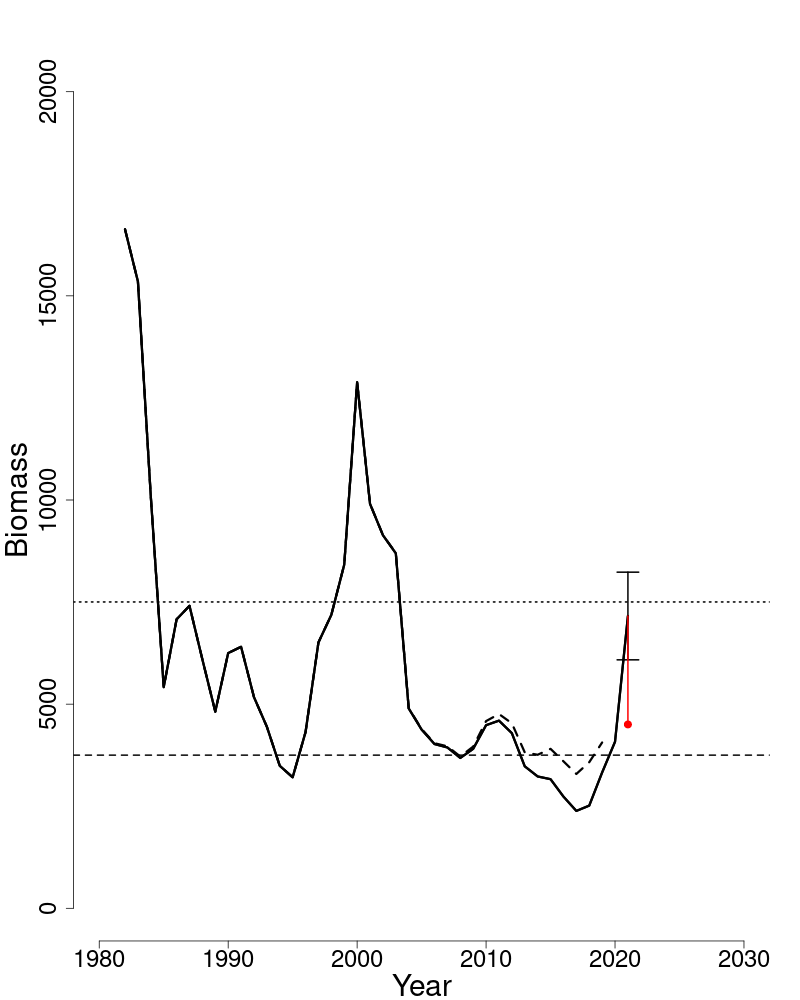
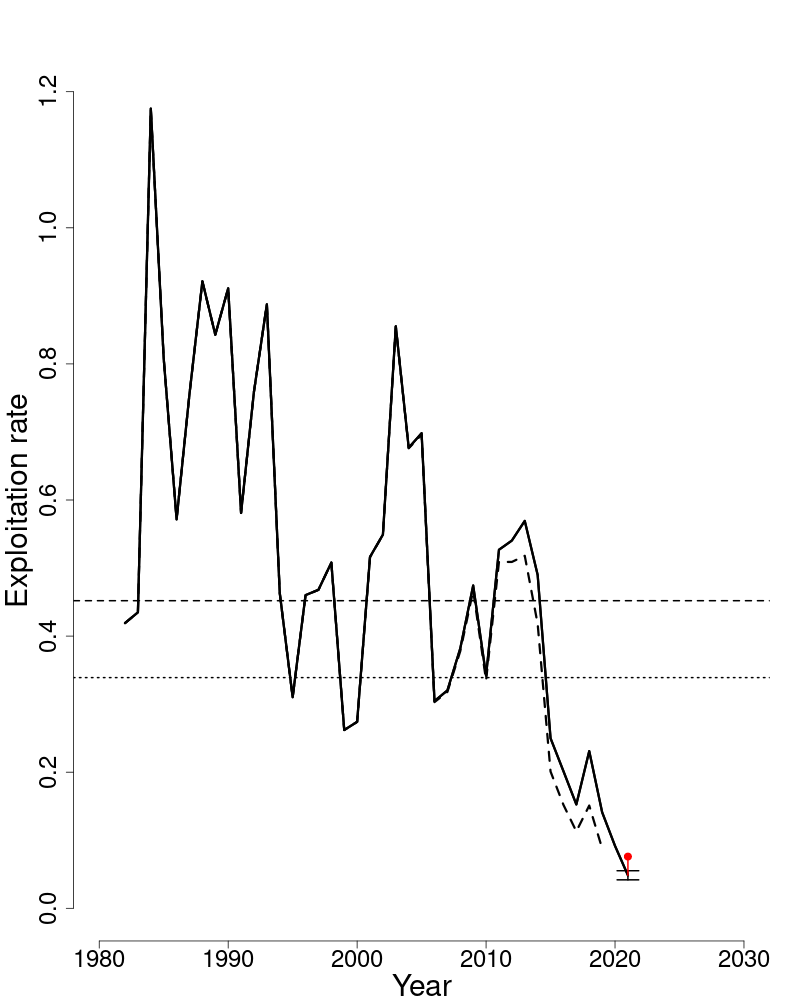
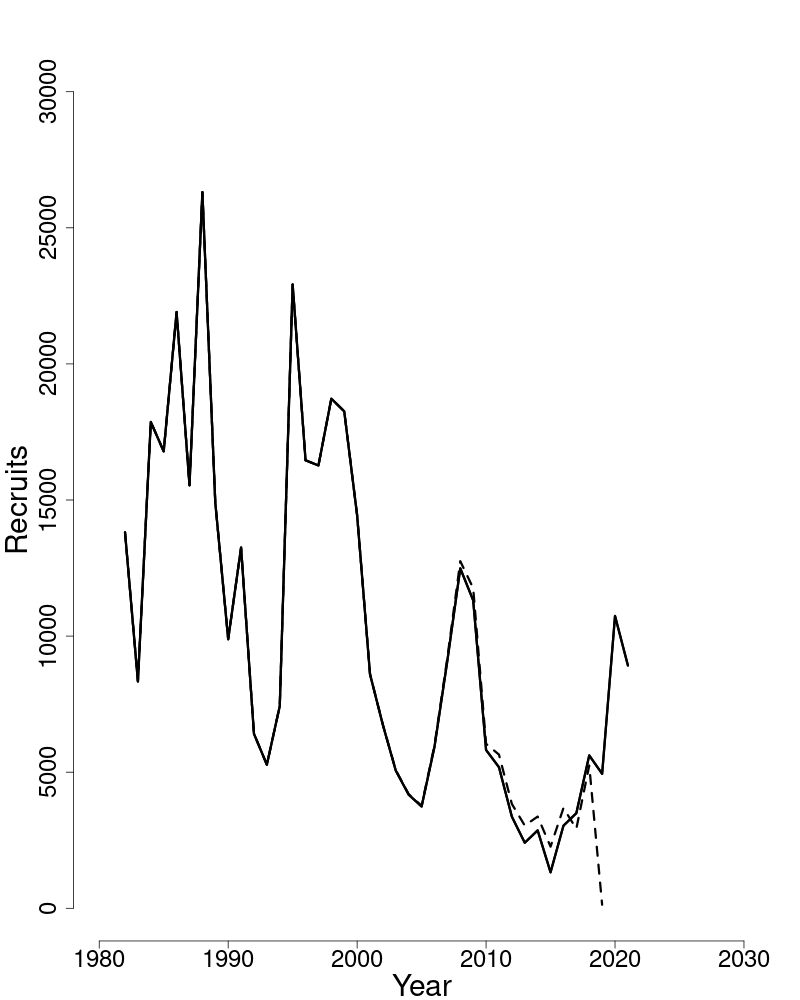
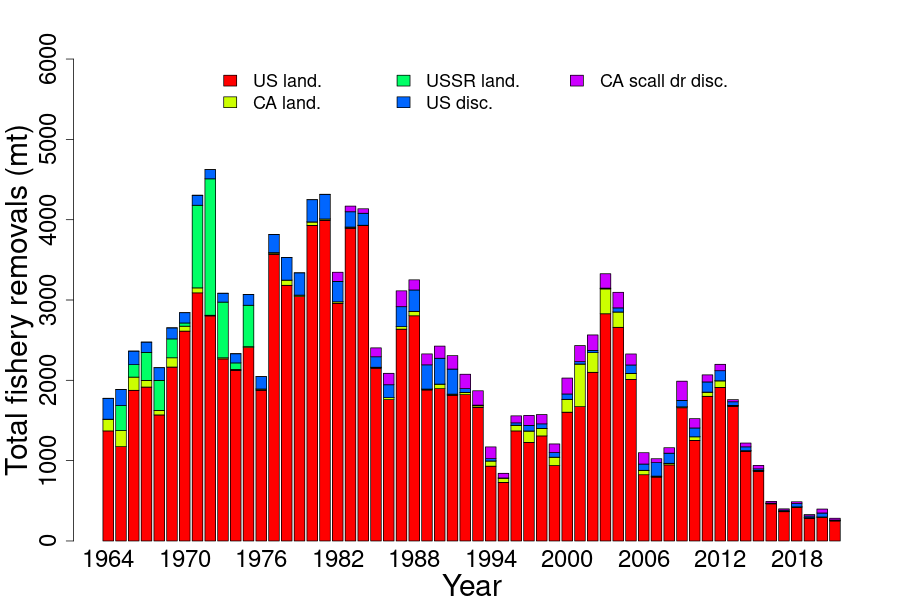
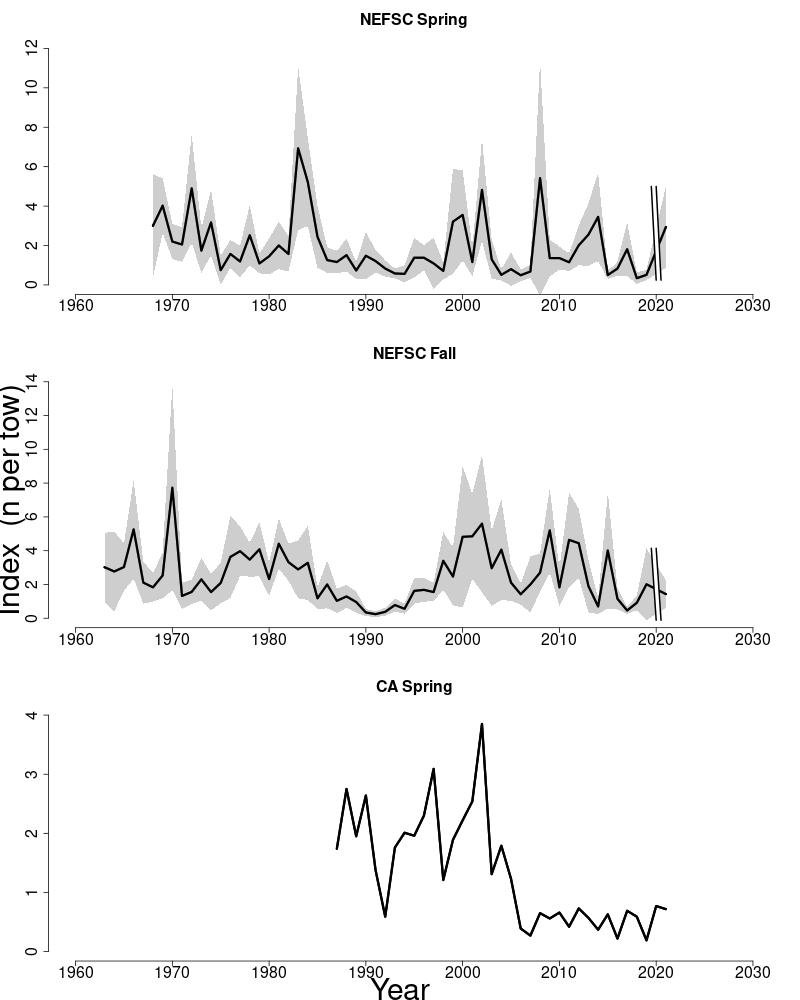
5. GEORGES BANK HADDOCK
This assessment of the Georges Bank haddock (Melanogrammus aeglefinus) stock is a Level 2 Management Track assessment of the 2021 research track assessment, which used the WHAM framework. Prior to the 2021 research track, the last benchmark for this stock was in 2008 (Brooks et al., 2008). Based on the previous update assessment in 2019 (NEFSC, 2022), the stock was not overfished, and overfishing was not occurring. Stock status was not reported for the 2021 research track, but the stock was not overfished and overfishing was not occurring. This assessment updates commercial fishery catch data, research survey indices of abundance, weights and maturity at age, and the WHAM assessment model and reference points through 2021. Stock projections have been updated through 2025. This report reflects decisions made during the Peer Review September 19–22, 2022.
State of Stock: Based on this updated assessment, the Georges Bank haddock (Melanogrammus aeglefinus) stock is not overfished, and overfishing is not occurring (Figures 15–16). Retrospective adjustments were not made to the model results. Spawning stock biomass (SSB) in 2021 was estimated to be 79,513 mt which is 66% of the biomass target (SSBMSY proxy= 120,580; Figure 15). The 2021 average fishing mortality on ages 5–7 was estimated to be 0.137 which is 55% of the overfishing threshold proxy (FMSY proxy= 0.25; Figure 16). The FMSY proxy is expressed as the average F on ages 5–7.
| 2014 | 2015 | 2016 | 2017 | 2018 | 2019 | 2020 | 2021 | |
|---|---|---|---|---|---|---|---|---|
| Data | ||||||||
| US Commercial discards | 1,409 | 1,552 | 1,880 | 786 | 410 | 306 | 178 | 49 |
| US Commercial landings | 4,240 | 4,762 | 3,682 | 3,217 | 4,017 | 5,252 | 6,648 | 3,641 |
| Canadian Catch | 12,953 | 14,374 | 11,713 | 13,384 | 12,222 | 14,160 | 11,052 | 7,001 |
| Catch for Assessment | 18,601 | 20,687 | 17,274 | 17,387 | 16,647 | 19,719 | 17,878 | 10,691 |
| Model Results | ||||||||
| Spawning Stock Biomass | 130,266 | 182,309 | 187,864 | 218,393 | 131,917 | 114,415 | 99,365 | 79,513 |
| F̅5:7 | 0.377 | 0.313 | 0.208 | 0.148 | 0.146 | 0.18 | 0.198 | 0.137 |
| Recruits (age-1) | 1,504,138 | 67,659 | 109,014 | 114,816 | 20,336 | 28,142 | 16,332 | 96,151 |
| 2019 | 2022 | |
|---|---|---|
| FMSY proxy | 0.33 | 0.25 |
| SSBMSY (mt) | 138,924 | 120,580 (94,687–153,555) |
| MSY (mt) | 24,400 | 25,494 (19,979–32,533) |
| Median recruits (age-1) (000s) | 59,143 | 25,607 (835–785,516) |
| Overfishing | No | No |
| Overfished | No | No |
Projections: Short term projections were conducted in WHAM, which propagates uncertainty in the processes of recruitment and transitions between numbers at age. For projection specifications, the Plan Development Team supplied an estimate of total catch for 2022, and fishing mortality was set equal to F40%SPR for 2023–2025. Annual fishery selectivity and maturity were fixed at a recent 2-year average (2020–2021 values), following analyses and decisions made at the 2021 research track. Weights at age for catch and SSB that were predicted from a Gaussian Markov Random Field (GMRF) model, rather than a recent 2-year average, were preferred by the peer reviewers for this Management Track, and were used in the projections summarized in this report. Retrospective adjustments were not applied. The Overfished threshold is 60,290 mt, and the stock is not projected to drop below this value in 2025.
| Year | Catch (mt) | SSB (mt) | F̅5:7 |
|---|---|---|---|
| 2022 | 9,914 | 79,457 (39,624–159,332) | 0.147 (0.069–0.311) |
| Year | Catch (mt) | SSB (mt) | F̅5:7 |
| 2023 | 18,482 (7,332–46,591) | 90,073 (35,695–227,286) | 0.272 |
| 2024 | 17,287 (5,680–52,616) | 81,027 (25,060–261,981) | 0.272 |
| 2025 | 14,555 (3,926–53,958) | 69,916 (17,543–278,641) | 0.272 |
Special Comments:
- •
What are the most important sources of uncertainty in this stock assessment? Explain, and describe qualitatively how they affect the assessment results (such as estimates of biomass, F, recruitment, and population projections).
Sources of uncertainty include dynamics in the plus group, the magnitude of the 2020 and 2021 year classes, and future assumptions about weights and selectivity at age. The 2013 year class, the largest ever observed for this stock, accounts for 20% of the population abundance in 2021 (at age-8), and is in the plus group for all of the projections. It’s contribution to catch (in biomass) in the projections is 35% in 2022, and diminishes to 17% in 2025. However, negative annual deviations have been estimated in the plus group in recent years, and it is uncertain if this will persist in projections. Catches in 2023–2025 are reliant on the 2020 year class, which constitutes 33%–41% of the 2023–2025 catch (in biomass). The 2022 year class is not part of the model input, but initial observations in the survey suggest that it may be close to the time series average; additional observations in future surveys are needed to confirm this. Projections from the research track assessment (with data through 2019) aligned well with estimates from the current assessment model (updated with data through 2021), in spite of the projected selectivities being consistently less than the model estimated selectivities from the current assessment. The accuracy of projected weights varied based on the year and year class, with some being very accurate and others over- or underestimated. A sensitivity projection was made using weights estimated from a Gaussian Markov random field (GMRF, methodology in Nielsen, manuscript in preparation), and the review panel recommended using these for projections instead of the 2-year average weights at age. These GMRF weights at age predicted a slightly greater increase in weights at age in later years of projections (with large uncertainty bounds), and consequently produced larger estimates of catch and SSB in 2022–2025 compared to projections using a two year average for weights at age. Long range accuracy for projecting weights and selectivity is not expected, given the many factors that influence those processes.
- •
Does this assessment model have a retrospective pattern? If so, is the pattern minor, or major? (A major retrospective pattern occurs when the adjusted SSB or F̅5:7 lies outside of the approximate joint confidence region for SSB and F̅5:7).
The 7-year Mohn’s ρ, relative to SSB, was 0.70 in the 2019 assessment and was 0.26 in 2021. The 7-year Mohn’s ρ, relative to F, was −0.44 in the 2019 assessment and was −0.27 in 2021. There was a minor retrospective pattern for this assessment because the ρ-adjusted estimates of 2021 SSB (SSBρ= 79,513) and 2021 F (Fρ= 0.137) were inside the estimated 95% confidence regions around SSB (46,084–137,174) and F (0.073–0.259). No retrospective adjustment was made for either the determination of stock status or for projections of catch in 2023.
- •
Based on this stock assessment, are population projections well determined or uncertain? If this stock is in a rebuilding plan, how do the projections compare to the rebuilding schedule?
As noted in the first bullet, population projections for Georges Bank haddock are uncertain due to future values of selectivity and weights at age, dynamics of the plus group, and magnitude of incoming 2020 and 2021 year classes. This stock is not in a rebuilding plan.
- •
Describe any changes that were made to the current stock assessment, beyond incorporating additional years of data and the affect these changes had on the assessment and stock status.
No changes, other than the incorporation of new data, were made to the Georges Bank haddock assessment for this update. NEFSC indices from 2009–2021 were calculated using tow-specific swept area.
- •
If the stock status has changed a lot since the previous assessment, explain why this occurred.
The stock status of Georges Bank haddock has not changed.
- •
Provide qualitative statements describing the condition of the stock that relate to stock status.
The Georges Bank haddock shows a broad age structure, and broad spatial distribution. This stock has produced several exceptionally strong year classes in the last 20 years, leading to record high SSB in the last decade. As the strong year classes age out of the population, abundance has returned to levels last observed in the early 2000s, which could potentially lead to an increase in weights at age as growth is released from density-dependent pressures. Catches in recent years have been well below the total quota (US+Canada), but projected catch levels will be substantially less than recent quotas due to declining abundance and the combined effect of re-estimated Canadian weights at age and a re-estimated length-based calibration for the NEFSC Albatross : H.B. Bigelow vessels.
- •
Indicate what data or studies are currently lacking and which would be needed most to improve this stock assessment in the future.
The research track assessment in 2021 for Georges Bank haddock strongly recommended studies to collect data to re-estimate gutted to whole weight conversion factors, as well as measuring individual fish weight in addition to the length and otolith sampling performed on commercially landed fish.
- •
Are there other important issues?
The Georges Bank haddock assessment estimates that the haddock stock has declined to levels last observed in the early 2000s. Projections at F40%SPR using GMRF weights at age predict a slight increase in SSB in 2023 but then a decline in 2024–2025. Projections at F40%SPR using a 2-year average for weights-at-age predicted a steady decline in SSB, with the stock on the cusp of overfished in 2024, and overfished in 2025. Future stock status is very dependent on assumed weights at age. Surges in stock abundance and quotas are driven by strong year classes, creating a boom and bust cycle. The current assessment shows the stock leaving the boom phase and heading in the bust direction. If initial estimates of the 2020 and 2021 year classes are at or above the time series average, this may slow the current decline.
5.1. Reviewer Comments: Georges Bank haddock
The 2022 assessment of the Georges Bank haddock (Melanogrammus aeglefinus) stock is the Management Track update of the 2022 Research Track assessment and also of the 2019 Operational Assessment (NEFSC 2022)1313 NEFSC. 2022. Operational Assessment of 14 Northeast Groundfish Stocks Updated Through 2018. US Dep Commer, NOAA Fisheries, Northeast Fish Sci Cent Ref Doc. 22-06; 227p.CRD22-06. Note that this assessment was also peer reviewed as part of the 2022 haddock Research Track assessment. Prior to the 2021–2022 research track, the last benchmark assessment for this stock was in 2008 (Brooks et al., 2008)1414 Brooks, E.N, M.L. Traver, S.J. Sutherland, L. Van Eeckhaute, and L. Col. 2008. In Northeast Fisheries Science Center. 2008. Assessment of 19 Northeast Groundfish Stocks through 2007: Report of the 3rd Groundfish Assessment Review Meeting (GARM III), Northeast Fisheries Science Center, Woods Hole, Massachusetts, August 4–8, 2008. US Dep Commer, NOAA Fisheries, Northeast Fish Sci Cent Ref Doc. 08-15; 884p+xvii.CRD08-15.
This assessment utilizes the Woods Hole Assessment Model (WHAM) and updates commercial fishery catch data, research survey indices of abundance, weights and maturity at age, and reference points through 2021. Stock projections have been updated through 2025.
Retrospective adjustments of the model results were not necessary. Spawning stock biomass (SSB) in 2021 was estimated to be 79,513 mt which is 66% of the biomass target (SSBMSY proxy= 120,580 mt). The 2021 average fishing mortality on ages 5–7 was estimated to be 0.137 which is 55% of the overfishing threshold proxy (FMSY proxy= 0.25). The F is expressed as the average F on ages 5–7, and FMSY proxy is F40%SPR.
Stock status was not reported for the 2021–2022 research track but based on this analysis the stock was not overfished and overfishing was not occurring.
Short term projections were conducted in WHAM, which propagates uncertainty in the processes of recruitment and deviations in transitions between ages. For projection specifications, the Plan Development Team supplied an estimate of total catch for 2022, and then fishing mortality was set equal to F40%SPR for 2023–2025. Annual fishery selectivity, maturity, and weights at age were fixed at 2020–2021 values, following analyses and decisions made at the 2021 research track. Weights at age for catch and SSB that were predicted from a Gaussian Markov Random Field (GMRF) model, rather than a recent 2-year average, were preferred by the peer reviewers for this management track and were used in the projections summarized in this report. The overfished threshold is 60,290 mt, and the stock is not projected to drop below this value in 2025.
The estimated catch for 2022 is 9914 mt, which results in catch advice of 18482, 17287, and 14555 mt for 2023–2025, respectively.
The Panel’s discussion on this assessment focused on the choice of Weight At Age (WAA) and selectivity functions to use in the projections. The Panel noted that the two functions seemed to show opposite trajectories over the past decade: WAA was decreasing while selectivity at age was increasing, which suggests that size-based selectivity is possible. However, the latter could have also been affected by fleet targeting and management changes.
Nonetheless, the question remained about which of the two approaches to WAA (i.e., two-year averaging or Gaussian Markov Random Field model [GMRF]) should be used for projections. Ultimately, the Panel recommended that the GMRF approach be used, in part because of its quick response to changes and because a model-based approach was more robust than a two-year average. The Panel recommends that the analyst continue to evaluate the utility/accuracy of GMRF vs averaging.
Finally, the Panel acknowledged that the eastern Georges Bank haddock stock assessment, also WHAM based, has produced a different interpretation of stock’s status and trajectory.
The Panel concluded that the 2022 assessment update for Georges Bank haddock fulfilled the recommendations of the AOP, is technically sufficient to evaluate stock status and provide scientific advice and meets the Terms of Reference for the stock’s assessment. The assessment represents Best Scientific Information Available (BSIA) for this stock for management purposes.
References:
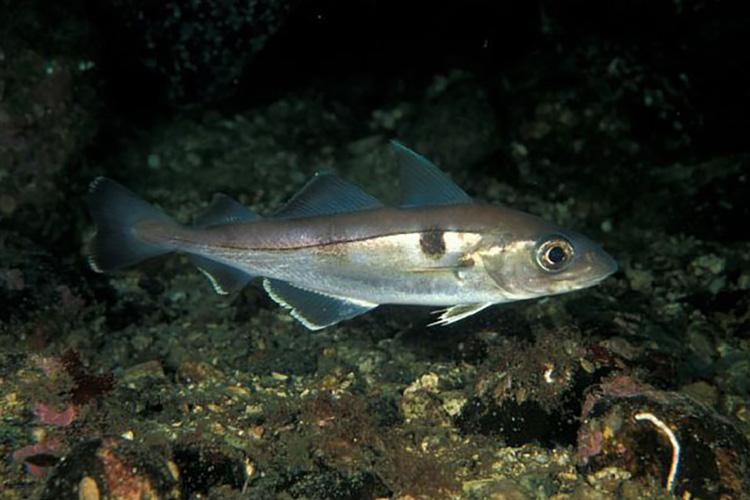
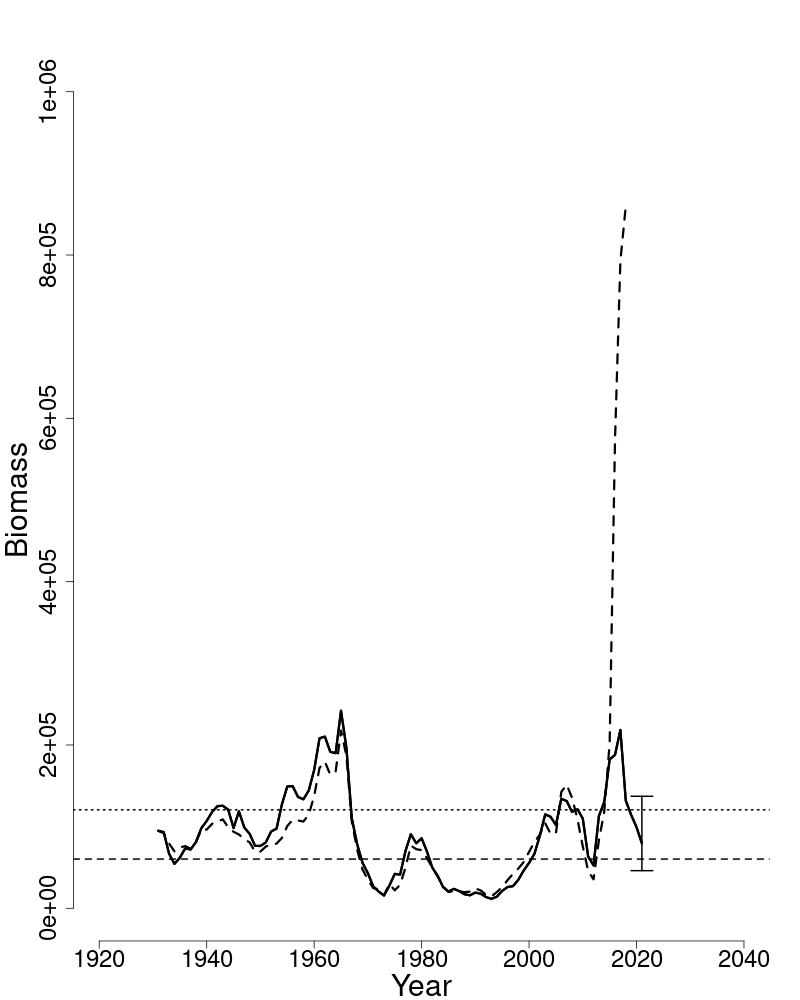
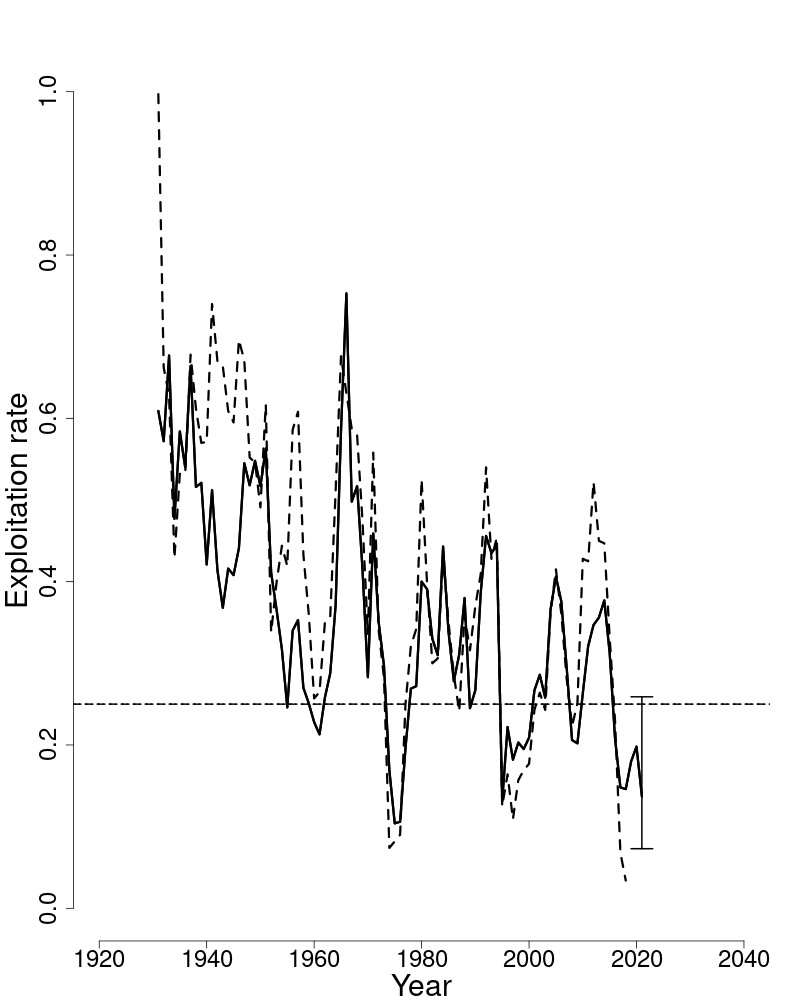
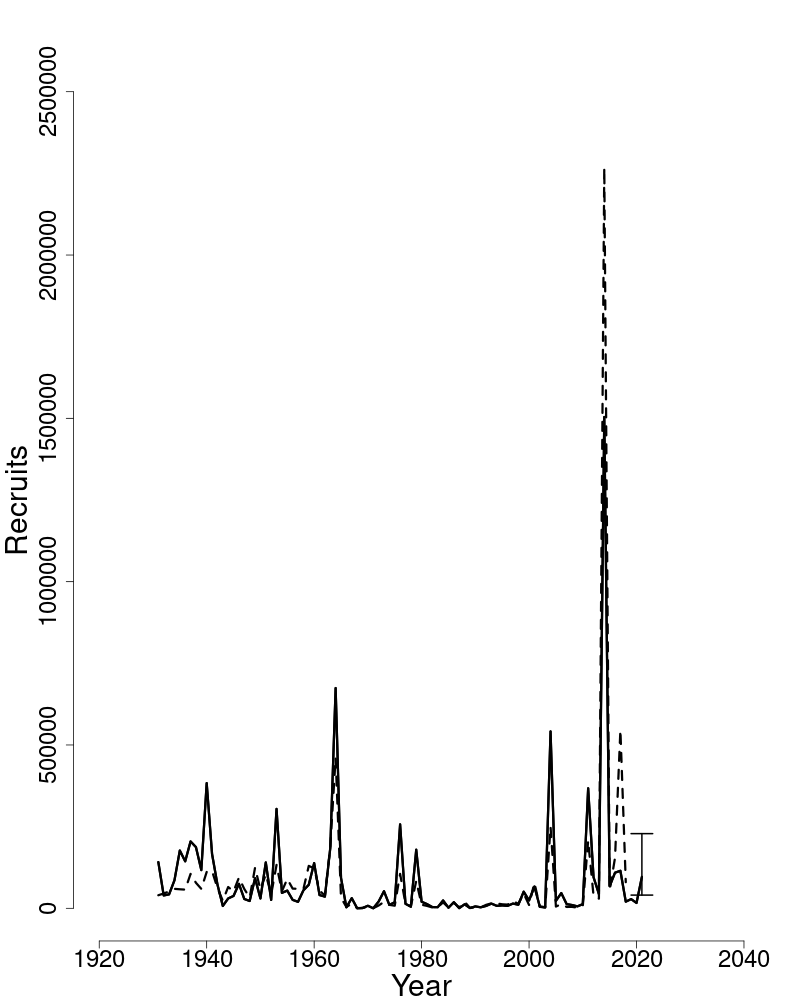
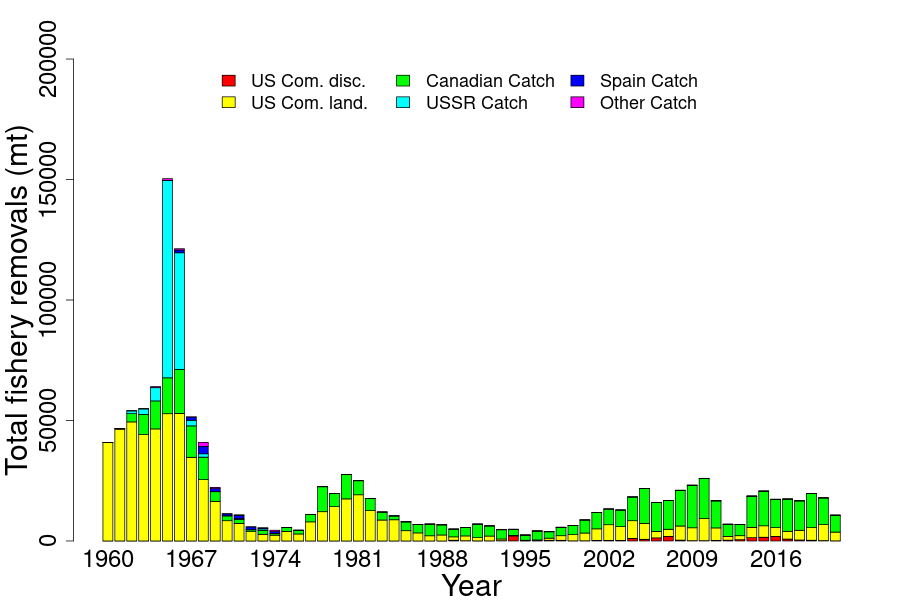
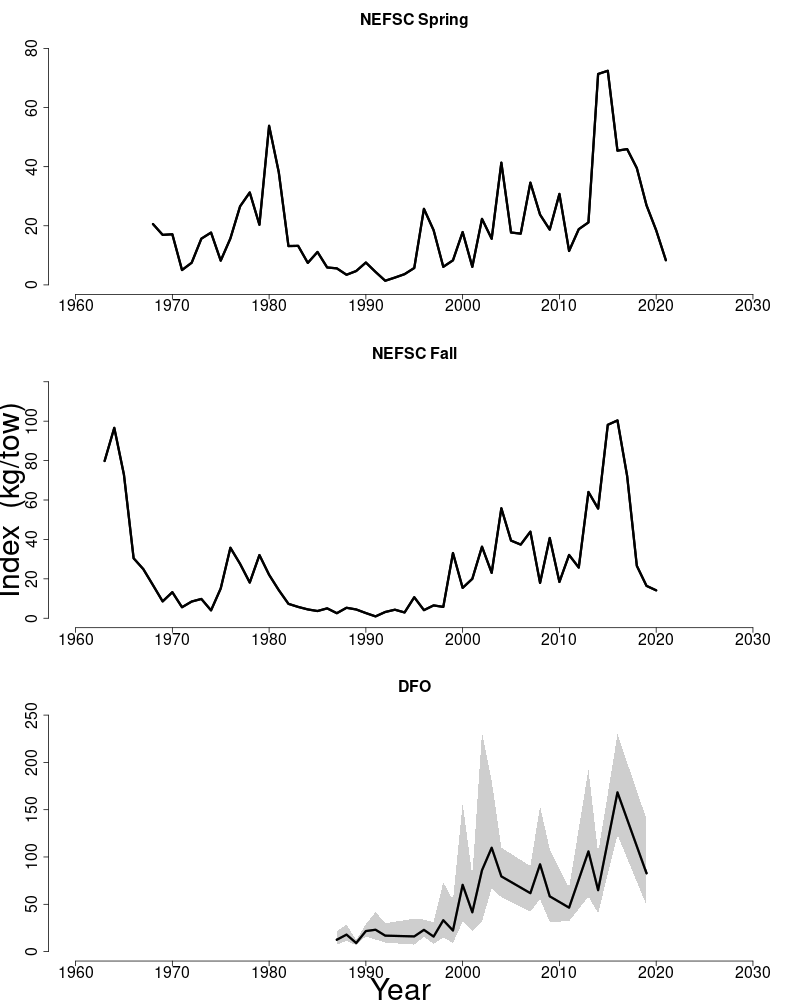
6. GULF OF MAINE HADDOCK
This assessment of the Gulf of Maine haddock (Melanogrammus aeglefinus) stock is a Management Track update assessment of the existing benchmark assessment (NEFSC, In Prep). Based on the previous Management Track assessment (NEFSC 2022), the stock was not overfished, and overfishing was not occurring. This assessment updates commercial and recreational fishery catch data, research survey indices of abundance, and the analytical ASAP assessment model and reference points through 2021. Additionally, stock projections have been updated through 2025
State of Stock: Based on this updated assessment, the stock status for the Gulf of Maine haddock (Melanogrammus aeglefinus) stock is not overfished and overfishing is occurring (Figures 20–21). Retrospective adjustments were not made to the model results (seeSpecial Comments section of this report). Spawning stock biomass (SSB) in 2021 was estimated to be 16,528 (mt) which is 270% of the biomass target (SSBMSY proxy = 6,123; Figure 20). The 2021 fully selected fishing mortality was estimated to be 0.375 which is 111% of the overfishing threshold proxy (FMSY proxy=F40%SPR= 0.338; Figure 21).
| 2014 | 2015 | 2016 | 2017 | 2018 | 2019 | 2020 | 2021 | |
|---|---|---|---|---|---|---|---|---|
| Data | ||||||||
| Recreational discards | 617 | 526 | 966 | 743 | 312 | 234 | 271 | 137 |
| Recreational landings | 456 | 295 | 1,026 | 1,787 | 801 | 778 | 909 | 722 |
| Commercial discards | 22 | 42 | 72 | 91 | 54 | 66 | 122 | 25 |
| Commercial landings | 314 | 650 | 1,342 | 2,273 | 2,542 | 3,464 | 3,556 | 3,718 |
| Foreign landings | 0 | 0 | 0 | 0 | 0 | 0 | 0 | 0 |
| Catch for Assessment | 1,410 | 1,512 | 3,406 | 4,894 | 3,710 | 4,542 | 4,858 | 4,602 |
| Model Results | ||||||||
| Spawning Stock Biomass | 9,787 | 19,437 | 32,445 | 36,189 | 34,312 | 29,887 | 22,988 | 16,528 |
| FFull | 0.346 | 0.217 | 0.278 | 0.27 | 0.176 | 0.212 | 0.282 | 0.375 |
| Recruits (age-1) | 83,932 | 4,915 | 5,169 | 6,976 | 5,629 | 2,080 | 3,059 | 22,781 |
Projections: Short term projections of median total fishery yield and spawning stock biomass for Gulf of Maine haddock were conducted based on a harvest scenario of fishing at the FMSY proxy between 2023 and 2025. Catch in 2022 has been estimated at 3,912 mt. Recruitment was sampled from a cumulative distribution function of model estimated age-1 recruitment from 1977–2019. The age-1 estimate in 2022 was generated from the geometric mean of the 1977–2021 recruitment series. The annual fishery selectivity in the projections was the terminal selectivity from the assessment model. The time-invariantmaturity ogive, and the projected mean weights-at-age were used in the projections. Retrospective adjustments were not applied in the projections.
| 2019 | 2022 | |
|---|---|---|
| FMSY proxy | 0.341 (0.281–0.412) | 0.338 (0.254–0.458) |
| SSBMSY (mt) | 7,993 (3,218–34,191) | 6,123 (2,864–19,628) |
| MSY (mt) | 1,597 (651–6,797) | 1,098 (507–3,533) |
| Median recruits (age-1) (000s) | 1,789 (285–17,883) | 1,753 (283–12,832) |
| Overfishing | No | Yes |
| Overfished | No | No |
| Year | Catch (mt) | SSB (mt) | FFull |
|---|---|---|---|
| 2022 | 3,912 | 14,920 | 0.471 |
| Year | Catch (mt) | SSB (mt) | FFull |
| 2023 | 2,515 | 16,002 | 0.338 |
| 2024 | 2,552 | 15,400 | 0.338 |
| 2025 | 2,434 | 13,189 | 0.338 |
Special Comments:
- •
What are the most important sources of uncertainty in this stock assessment? Explain, and describe qualitatively how they affect the assessment results (such as estimates of biomass, F, recruitment, and population projections).
The main source of uncertainty in this assessment is the faster than expected rate of decline in biomass that has occurred since the last update. Although the last update projected a decline in biomass, the realized decline has been faster than anticipated, and this has resulted in a substantial increase in F which is now above the overfishing threshold.
- •
Does this assessment model have a retrospective pattern? If so, is the pattern minor, or major? (A major retrospective pattern occurs when the adjusted SSB or FFull lie outside of the approximate joint confidence region for SSB and FFull).
This assessment exhibits a retrospective pattern, however the 7-year Mohn’s ρ-adjusted values of SSB and F fall within the 90% confidence interval of their estimates, therefore the pattern is considered minor, and no retrospective adjustment is required.
- •
Based on this stock assessment, are population projections well determined or uncertain? If this stock is in a rebuilding plan, how do the projections compare to the rebuilding schedule?
Population projections for Gulf of Maine haddock in the previous update correctly identified that the population would decline, however the rate of decline has been faster than projected. As a result, the projected 2021 SSB from the last assessment is above the upper confidence bound of the 2021 SSB estimated in the current assessment. The over-projection of SSB was magnified by a change in direction of the retrospective pattern and over-projected weights-at-age, the latter of which has been addressed in this update using a new weight-at-age projection model. The projected F for 2022 is above the overfishing threshold (Table 15). This stock is not in a rebuilding plan.
- •
Describe any changes that were made to the current stock assessment beyond incorporating additional years of data, and the effect these changes had on the assessment and stock status.
The actual tow-swept-area was used when calculating the NEFSC Bottom Trawl indicies of abundance for the R/V Bigelow years (2009+). A comparison of the survey time series with and without this adjustment showed that the impact on the time series is minor. In addition, following the recommendation of the 2021 Research Track Review Panel (CIE, In Prep), an exploratory model run was performed which included the NEFSC Bottom Longline Survey (BLLS). Model diagnostics were generally worse when including the BLLS, particularly the retrospective pattern, and therefore the Base model was chosen as the preferred model. Also following the recommendation of the Research Track Review Panel, a state-space growth model was developed for projecting WAA. In a 20-year retrospective backtest, the growth model outperformed the previous approach of using the terminal two-year average, and therefore it was chosen as the WAA projection method in this update.
- •
If the stock status has changed a lot since the previous assessment, explain why this occurred.
Unlike the previous assessment (NEFSC 2022), overfishing is now occurring. See above comments on why this occurred. The stock remains not overfished.
- •
Provide qualitative statements describing the condition of the stock that relate to stock status.
The Gulf of Maine haddock stock has experienced several large year classes since 2010, particularly the 2013 year class. The stock has recently declined as these large year classes have aged out. The 2020 year class is currently estimated as the second largest on record, however it is still substantially smaller than the 2013 year class and its estimate is highly uncertain. Future stock status will depend on the strength of this and subsequent year classes.
- •
Indicate what data or studies are currently lacking and which would be needed most to improve this stock assessment in the future.
A better understanding of what is driving the retrospective pattern would be helpful.
- •
Are there other important issues?
None.
6.1. Reviewer Comments: Gulf of Maine haddock
The 2022 assessment of the Gulf of Maine haddock (Melanogrammus aeglefinus) stock is the Management Track update of the 2021 Research Track assessment and 2019 Operational Assessment (NEFSC 2022)1515 NEFSC 2022. Operational Assessment of 14 Northeast Groundfish Stocks Updated Through 2018. US Dep Commer, NOAA Fisheries, Northeast Fish Sci Cent Ref Doc. 22-06; 227p.CRD22-06. Note that this assessment was also peer reviewed as part of the 2021 haddock Research Track assessment. This assessment updates commercial and recreational fishery catch data, research survey indices of abundance, and the analytical ASAP assessment model and reference points through 2021. Stock projections have been updated through 2025.
The Panel concluded that the 2022 assessment update for Gulf of Maine haddock fulfilled the recommendations of the AOP, is technically sufficient to evaluate stock status and provide scientific advice and meets the Terms of Reference for the stock’s assessment. The assessment represents Best Scientific Information Available (BSIA) for this stock for management purposes.
Terms of Reference: Gulf of Maine haddock
- 1.
Estimate catch from all sources including landings and discards.
The Panel was concerned about the low level of Port side sampling of commercial landings that has occurred since 2019.
- 2.
Evaluate indices used in the assessment (e.g., indices of relative or absolute abundance, recruitment, state surveys, age-length data, etc.).
This TOR was satisfactorily addressed.
Spring and fall tow-specific swept area NEFSC bottom trawl survey indices as well as survey maturities, and weights at age were updated through 2021 (2020 surveys were not conducted). The NEFSC 2014–2021 Bottom Longline Survey results were also considered for inclusion in the model.
- 3.
Estimate annual fishing mortality, recruitment and stock biomass (both total and spawning stock) as possible (depending on the assessment method) for the time series using the approved assessment method and estimate their uncertainty. Include retrospective analyses if possible (both historical and within-model) to allow a comparison with previous assessment results and projections, and to examine model fit.
- (a)
Include bridge runs to sequentially document each change from the previously accepted model to the updated model proposed for this peer review.
- (b)
Prepare a backup assessment approach that would serve as an alternative for providing scientific advice to management if the analytical assessment were to not pass review.
The Base model used here was the final accepted ASAP model from the 2021 Haddock Research Track Assessment for 1977–2021 (1977 is the first year catch-at-age is available). Maturity was from the 1977–2021 time series average, assumed natural mortality M= 0.2, and SSB weights-at-age use Rivard calculation. Commercial and recreational catches were for ages 1–9+ with Weights-at-Age (WAA) estimated from the most recent 5-year average. A combined commercial and recreational fleet was modeled with three selectivity blocks (at-age) 1977–1988, 1989–2004, 2005+. For the surveys, selectivity was freely estimated at-age (fixed 4+ (spring), 6+ (fall)) and catchability was fixed over time.
The NEFSC Bottom Longline Survey (BLLS) was included as an exploratory model in addition to the NEFSC Bottom Trawl Survey data, as recommended by the GOM Haddock Research Track Review Panel. The configuration of the BLLS model was identical to the Base model, with the addition of the BLLS survey. BLLS selectivity was freely estimated at-age and fixed for ages 6+ (spring) and 5+ (fall).
A Bridge run was prepared to compare the 2019 Management Track (MT) model with the 2021 Research Track (RT) model with the updated 2022 MT original base model and base+BLLS. Model estimates of SSB, F, and recruits were comparable.
The Panel spent significant time discussing whether to include the BLLS in this assessment. While the Panel agreed the BLLS provided additional useful information with the model providing a good fit for the BLLS survey results, overall diagnostics suggested it degraded the quality of the model. It increased Mohn’s ρ from 0.30 in the 2022 base model to 0.48 in the BLLS model, which was a doubling of the ρ from the 2021 RT model. Ultimately, the Panel agreed to recommend the BLLS not be included in the 2022 MT model but be reconsidered in the next assessment once 2 more years of data are available.
- (a)
- 4.
Re-estimate or update the BRP s as defined by the management track level and recommend stock status. Also, provide qualitative descriptions of stock status based on simple indicators/metrics (e.g., age- and size-structure, temporal trends in population size or recruitment indices, etc.).
This TOR was satisfactorily addressed.
Retrospective adjustments were not made to the model. Spawning stock biomass (SSB) in 2021 was estimated to be 16,528 mt which is 270% of the biomass target (SSBMSY proxy= 6,123 mt). The 2021 fully selected fishing mortality was estimated to be 0.375 which is 111% of the overfishing threshold proxy (FMSY proxy=F40%SPR = 0.338).
Based on this updated assessment, the stock’s status is not overfished and overfishing is occurring.
- 5.
Conduct short-term stock projections when appropriate.
This TOR was satisfactorily addressed.
Short term projections of median total fishery yield and spawning stock biomass for Gulf of Maine haddock were conducted based on a harvest scenario of fishing at the FMSY proxy between 2023 and 2025. Recruitment was sampled from a cumulative distribution function of model estimated age-1 recruitment from 1977–2019. The age-1 estimate in 2022 was generated from the geometric mean of the 1977–2021 recruitment series. The annual fishery selectivity in the projections was the terminal selectivity from the assessment model. The time-invariant maturity ogive and projected mean weights at age derived from a state-space growth model were used in the projections. Retrospective adjustments were not applied in the projections.
The estimated catch for 2022 is 3912 mt, which results in catch advice of 2515, 2552, and 2434 mt for 2023–2025, respectively.
The Panel discussed whether to use the recent 2-year average or the state-space growth model predictions for estimates of WAA in projections. The growth model tracks growth curves of cohorts to predict future WAA and results in lower projections of WAA in the future than the 2-year average with lower projected catch in 2023–2024 and higher SSB. Based on the growth model fits to catch weights and SSB weights, the Panel recommended using the growth model for WAA in the projections.
- 6.
Respond to any review panel comments or SSC concerns from the most recent prior research or management track assessment.
This TOR was partially addressed in that the Research Track Peer Review Panel recommendations on the Bottom Longline Survey and the Weight-At-Age analysis were fully addressed by the assessor. Other items remaining to be dealt with by the assessor include consideration of variable M values to incorporate age and system variability (including the effect on management advice), and the appropriateness of the F40%SPR proxy. Remaining research from the Review Panel including the generation of testable hypotheses to explain recruitment variability in the Gulf of Maine (including an updating of the fall bloom relationship to recruitment) are not the responsibility of the assessor.
Research recommendations from this Panel included:
- •
- •
This stock should be considered for evaluation using a state-space framework, which could provide insight into the rapid decline in biomass. The Panel suggested that Gulf of Maine haddock may be included as a case study in the State-Space Modeling Research Track effort to be convened soon.
- •
Low Port sampling of landings is a problem for this and many other stocks. NMFS should either return this sampling to pre 2109 levels or consider data from observer sampling.
References:
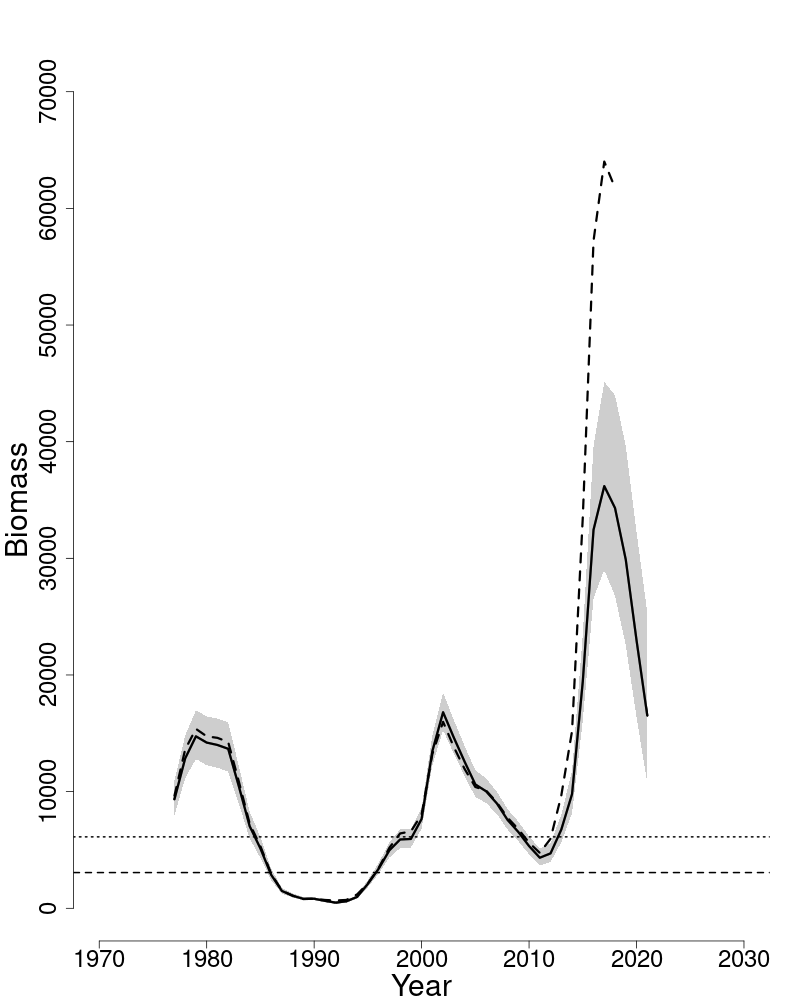
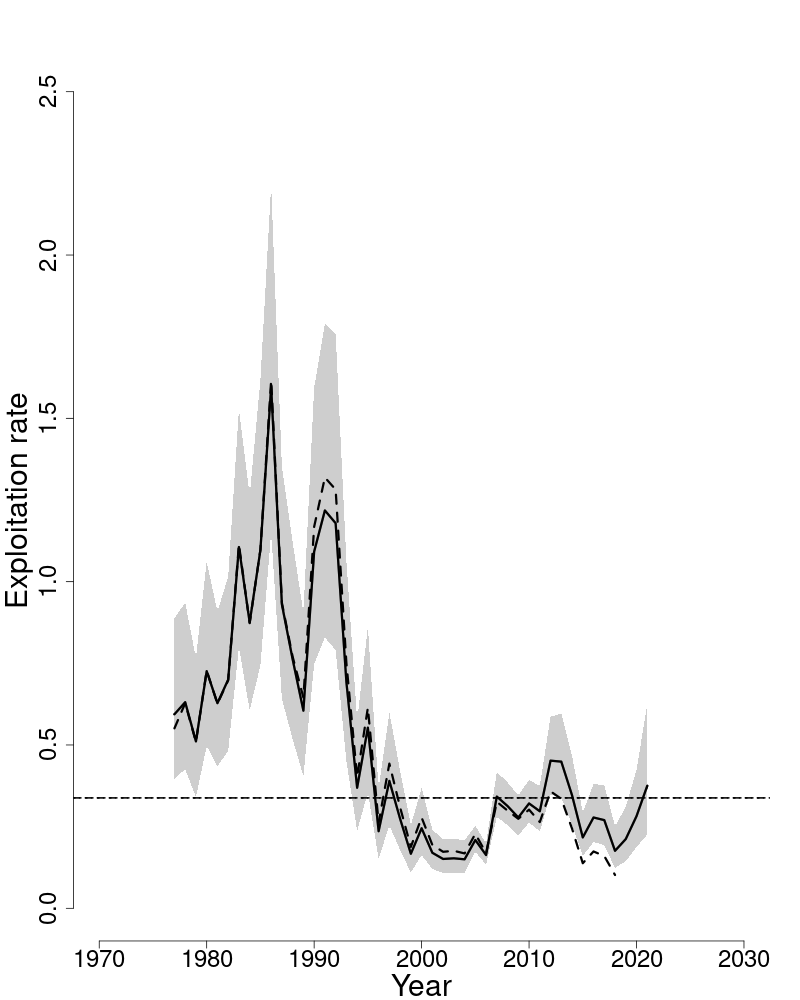
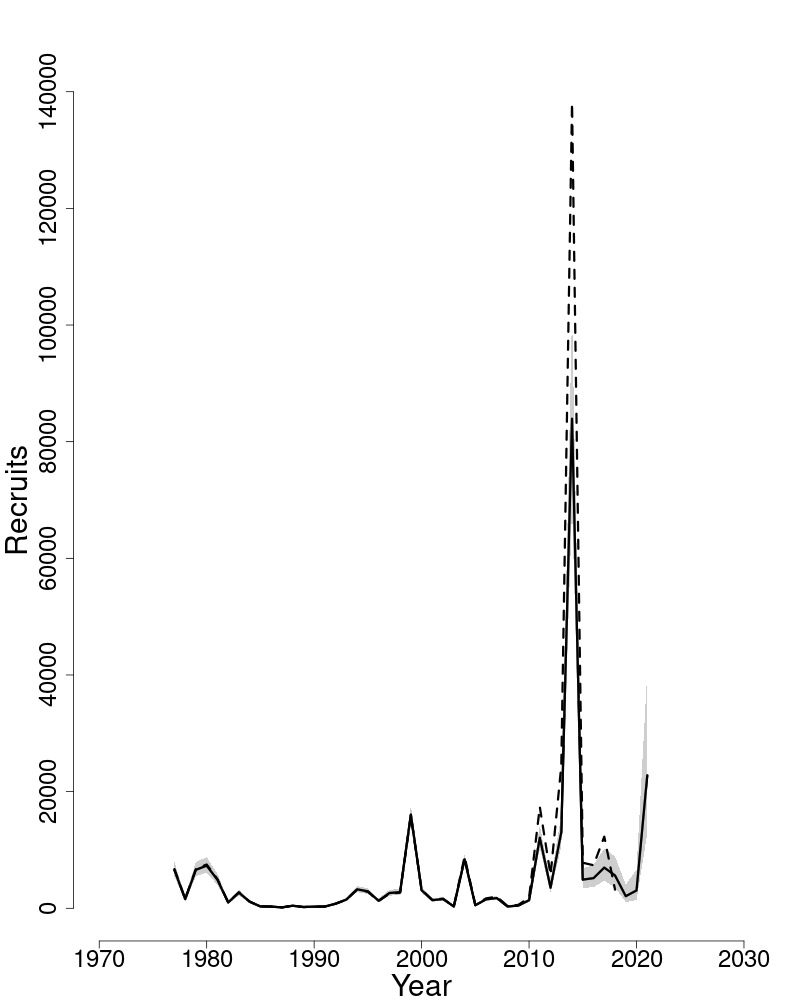
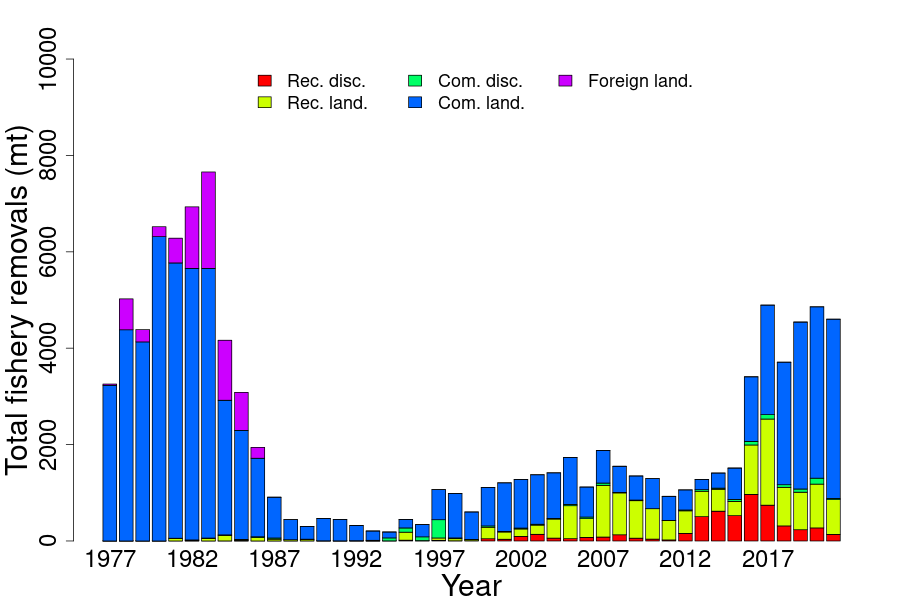
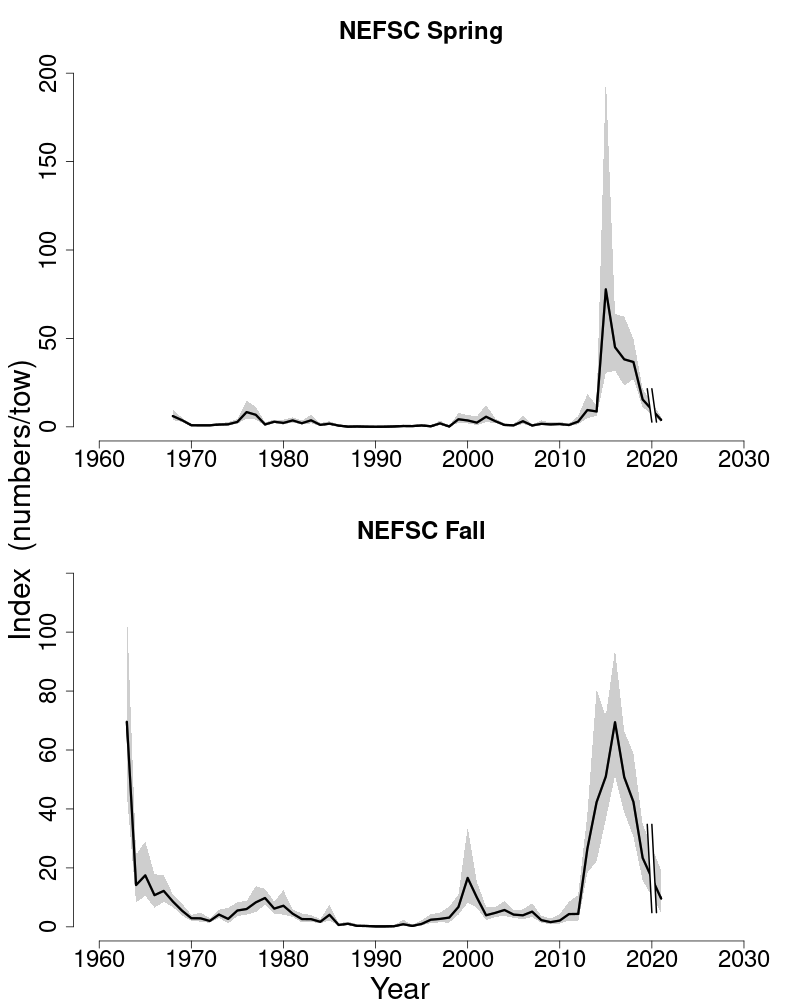
7. ATLANTIC HALIBUT
This assessment of the Atlantic halibut (Hippoglossus hippoglossus) stock is an update of the existing 2019 ‘Plan B’ assessment (Rago, 2018). This assessment updates commercial fishery catch data, commercial and survey indices of abundance, and the First Second Derivative (FSD) model through 2021. Reference points are unknown and have not been updated.
State of Stock: Based on this updated assessment, Atlantic halibut (Hippoglossus hippoglossus) stock status cannot be determined analytically due to a lack of biological reference points associated with the FSD method. Biomass (SSB) in 2021 was unknown. The 2021 fully selected fishing mortality was unknown.
| 2014 | 2015 | 2016 | 2017 | 2018 | 2019 | 2020 | 2021 | |
|---|---|---|---|---|---|---|---|---|
| Data | ||||||||
| Commercial discards | 26 | 23 | 31 | 27 | 46 | 75 | 37 | 26 |
| Commercial landings | 45 | 62 | 68 | 64 | 54 | 50 | 48 | 39 |
| CA landings | 33 | 30 | 34 | 35 | 46 | 54 | 156 | 120 |
| Catch for Assessment | 104 | 115 | 133 | 125 | 146 | 178 | 240 | 185 |
| Model Results | ||||||||
| Catch Multiplier | 1.02 | 1.18 | 1.02 | 1.02 | 0.94 | 0.84 | 0.92 | 0.87 |
| Catch Advice | 141 | 106 | 136 | 136 | 128 | 138 | 149 | 220 |
| 2019 | 2022 | |
|---|---|---|
| FMSY proxy | NA | |
| SSBMSY (mt) | NA | |
| MSY (mt) | NA | |
| Overfishing | Unknown | Unknown |
| Overfished | Unknown | Unknown |
Projections: Short term projections are not possible using the FSD approach. The FSD approach is based on applying a multiplier to the catch from the previous year and cannot be projected beyond the catch time series. The catch multiplier for 2021 resulting from the FSD model is 0.87 and the estimatedcatch for 2021 is 185 mt, which results in catch advice of 160 mt for 2022. The FSD model is explained in (Rago, 2018) and additional information is available in a document called ‘AtlanticHalibutMTextras.pdf’, both are available atSASINF .
Special Comments:
- •
What are the most important sources of uncertainty in this stock assessment? Explain, and describe qualitatively how they affect the assessment results (such as estimates of biomass, F, recruitment, and population projections).
The assessment model (FSD) used for Atlantic halibut is a ‘Plan B’ assessment method. It uses recent trends in 3 abundance indices as well as recent changes in those trends to adjust the previous year’s catch. For example, if the abundance indices are increasing, the catch will be adjusted up. If that increasing trend in abundance is increasing in magnitude over time, the adjustment to catch will be commensurately higher. The FSD method was rigorously tested in simulation (Rago, 2018) and should perform well for Atlantic halibut in the US. Sources of uncertainty in the FSD method include process error related to potential changes in stock productivity over time, the choice of relative weights for the control parameters used in the model and the lag in information inherent in using change in trend as one of the control parameters, which requires dropping one data point from the regression fit to generate a comparison. Other sources of uncertainty include the observation error in the abundance indices. The FSD method also relies on the assumption that abundance can be described with linear dynamics, but that assumption should be relatively unimportant if the stock abundance is well below it’s theoretical carrying capacity.
- •
Does this assessment model have a retrospective pattern? If so, is the pattern minor, or major?
The FSD model does not support retrospective analysis.
- •
Based on this stock assessment, are population projections well determined or uncertain?
The FSD model provides catch advice in the year following the terminal year of the input data. It is not intended to to project further ahead than one year. It is possible however to assume that catch in the year following the terminal year will equal the catch advice from the FSD model and that the population abundance indices will continue to follow the same trend and that the change in trend will be identical to the previous five years of data. These assumptions allow for a projection any number of years into the future. The relative quality of these projections degrades as the indices of abundance depart from the behavior of the most recent data available to the model.
- •
Describe any changes that were made to the current stock assessment, beyond incorporating additional years of data and the affect these changes had on the assessment and stock status.
The loss of a survey data point in 2020 (Covid) resulted in the need to interpolate one survey index observation. The survey index value used in 2020 was equal to the average of the 2019 and 2021 values.Catch efficiency studies and data are not used for the Atlantic halibut assessment because not enough Atlantic halibut are caught to provide a comparison between the gear types and produce estimate of catchability.
- •
If the stock status has changed a lot since the previous assessment, explain why this occurred.
Stock status cannot be determined and remains unchanged. The stock is likely depleted relative to its virgin biomass based on estimates of historical landings, which were much higher than current landings. Rago in his 2018 report argued that overfishing was unlikely because the catch multiplier estimated in the FSD model had been greater than one for several years. The catch multiplier has now been less than one for four years, which would be consistent with recent overfishing. There is however, no way to determine stock status without reference points.
- •
Indicate what data or studies are currently lacking and which would be needed most to improve this stock assessment in the future.
The Atlantic halibut assessment could be improved with more precise fishery independent indices of abundance, additional age and length composition data, and a better understanding of stock structure. These would allow for alternative assessment methods, and potential development of a more sophisticated stock assessment model.
- •
Are there other important issues?
Canadian catch in 2020 and 2021 in area 5Z (eastern Georges Bank) was 4 times higher than it has been in at least the last 20 years (seeSASINF ). Because this area is included in the calculation of catch in the FSD model, the recommended catch output (catch advice) for 2021 and 2022 is at or above status quo (circa 2017–2019). This result is counter to expectation given that the catch multiplier for each year since 2017 indicates a reduction in recommended catch is warranted (Table 16). Managers should be aware of this issue when recommending catch levels for Atlantic halibut.
7.1. Reviewer Comments: Atlantic halibut
The 2022 assessment of Atlantic halibut (Hippoglossus hippoglossus) updates the 2019 ‘Plan B’ assessment use of the First Second Derivative (FSD) model (Rago 2018)1616 Rago, P.J. 2018. Halibut Assessment Report for 2017 for New England Fishery Management Council, January 24, 2018. Unpublished report. Available online atSASINF. with additional commercial fishery catch data, commercial discard indices and fall bottom trawl survey indices of abundance through 2021.
A ‘Plan B’ assessment does not allow for the estimation of reference points (i.e., FMSY, and SSBMSY cannot be determined).
Short-term projections are not possible using the FSD approach. The FSD approach is based on applying a multiplier to the catch from the previous year and cannot be projected beyond the catch time series. The catch multiplier for 2021 resulting from the FSD model is 0.85 and the estimated catch for 2021 is 174 mt, which results in catch advice of 149 mt for 2022.
The Panel considered the analyst’s recommendation that Atlantic halibut’s stock status should be considered unknown. Given that there is no accepted previous assessment to provide stock status and that the “Plan B" approach does not generate reference points, the Panel strongly recommended listing stock status as unknown.
The Panel raised two concerns with this assessment. The first was the intersection of the US fishery and stock with those of Canada’s fishery and stock. Even though the US assessment tries to account only for the portion of the Atlantic halibut stock that is found on Georges Bank and the Gulf of Maine, it is possible (perhaps likely) that this is only one part of a larger stock of Atlantic halibut that extends onto the Canadian Scotian shelf. Tracking data available from halibut released in the Gulf of Maine suggest a significant number of these fish travel into Canadian waters. The recent high catches of halibut by Canadian fisheries on Georges Bank (e.g., in area 5ZEJ) can only be sustainable if the area is part of a larger stock. As such, the Panel recommended that NMFS and DFO develop a more coordinated approach to the assessment of Atlantic halibut across the region. The Panel endorses at the least a scientific workshop to discuss the stock’s science.
The second, much smaller concern, was how the missing fall 2020 survey was treated in the analysis. Imputing or smoothing by averaging values between the two surveys before and after 2020 was the agreed upon recommendation.
For the next Management Track assessment of the stock, consider different weighting of the commercial discard and survey abundance indices and the potential for use of a CPUE index.
The Panel concluded that the 2022 assessment update for Atlantic halibut fulfilled the recommendations of the AOP and is technically sufficient to provide scientific advice and meets the Terms of Reference for the stock’s assessment. It does not provide sufficient information to evaluate stock status. The assessment represents Best Scientific Information Available (BSIA) for this stock for management purposes.
References:
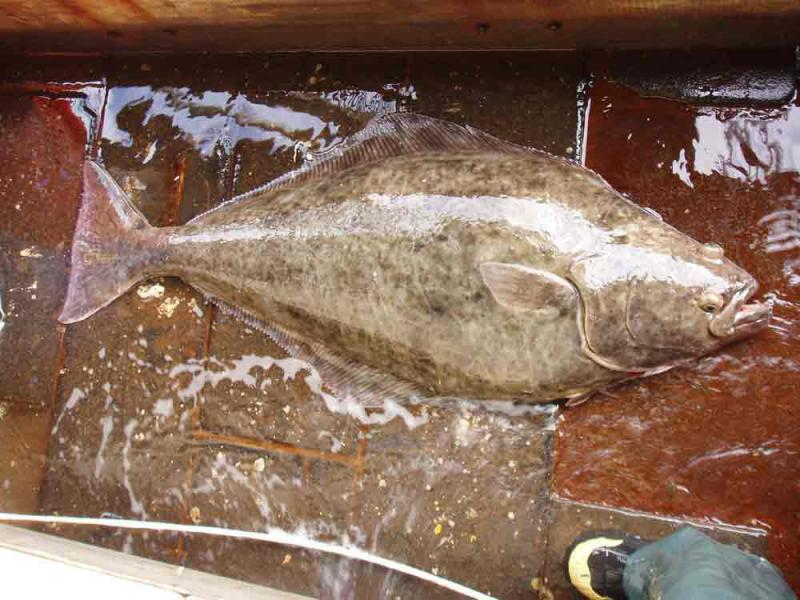
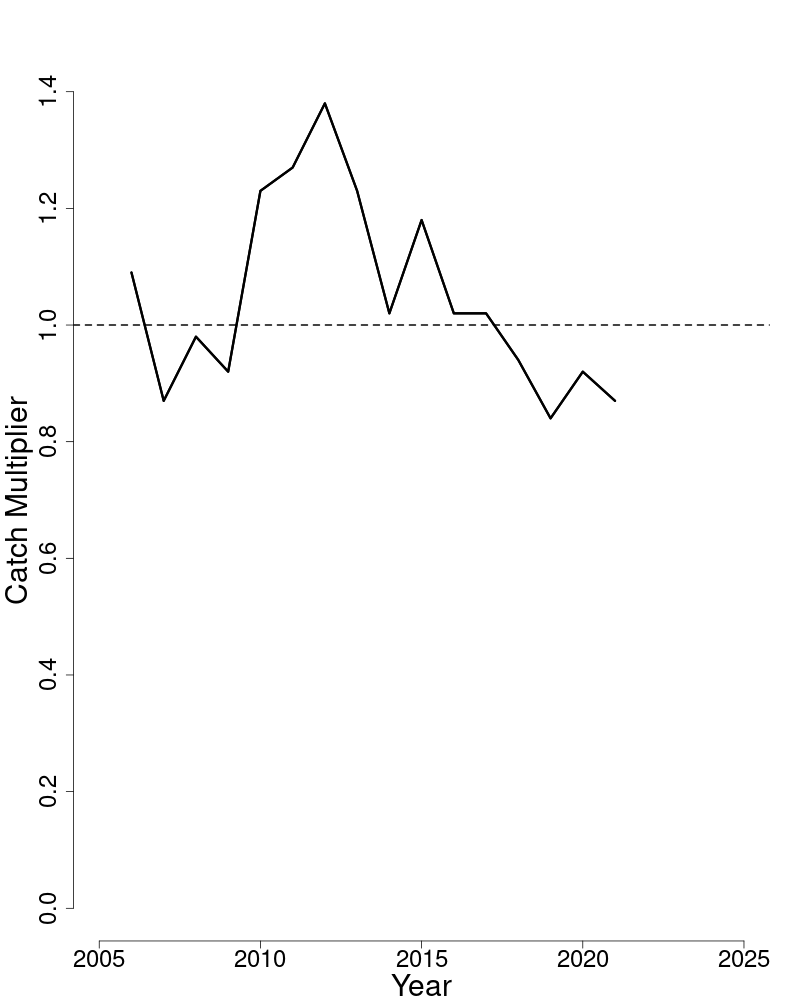
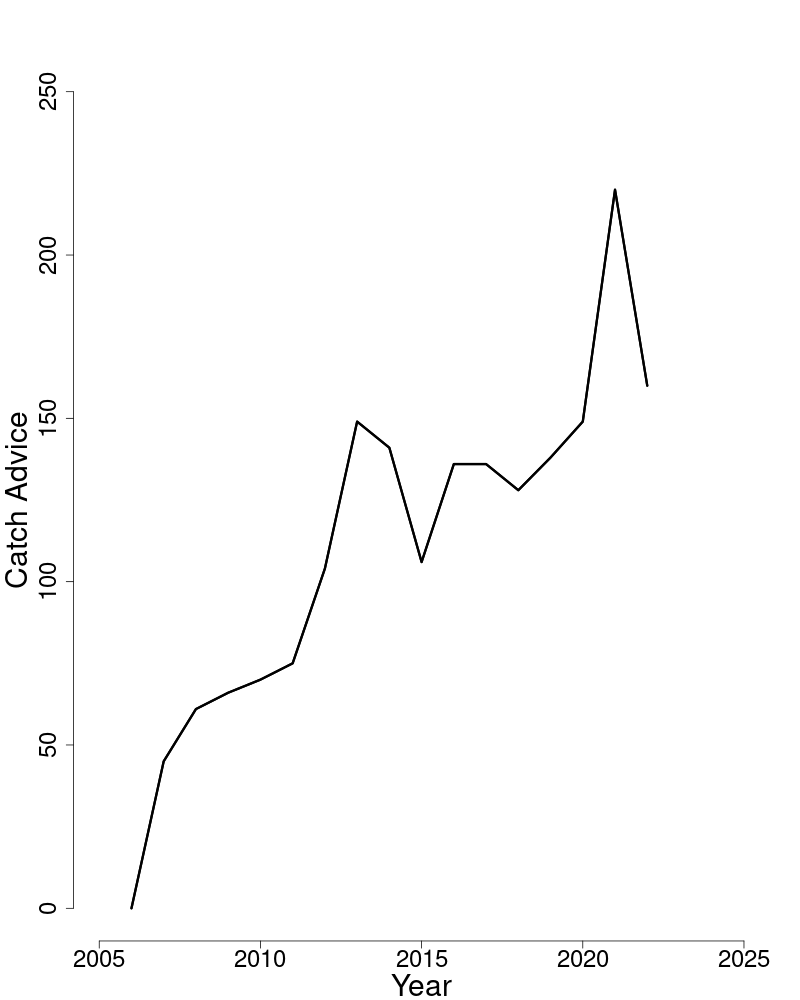
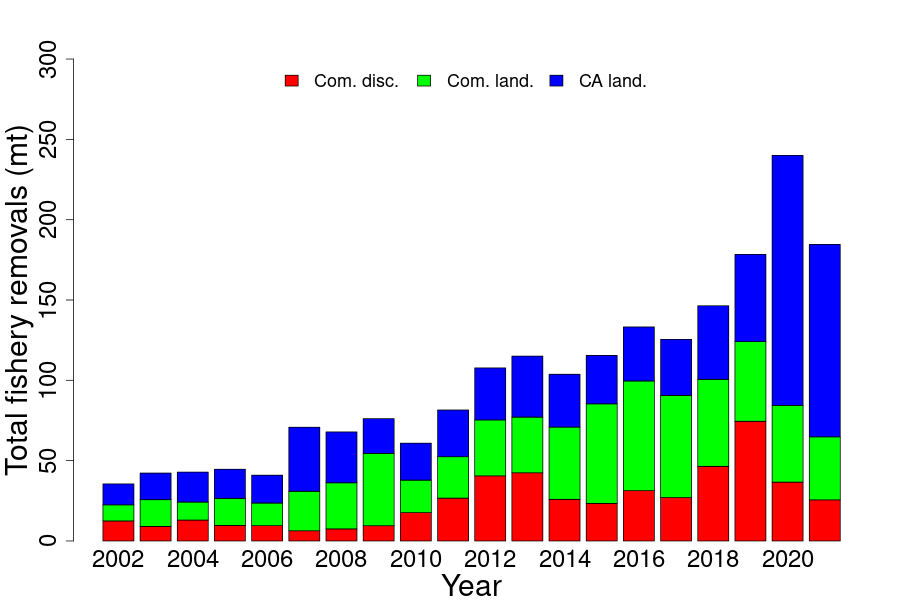
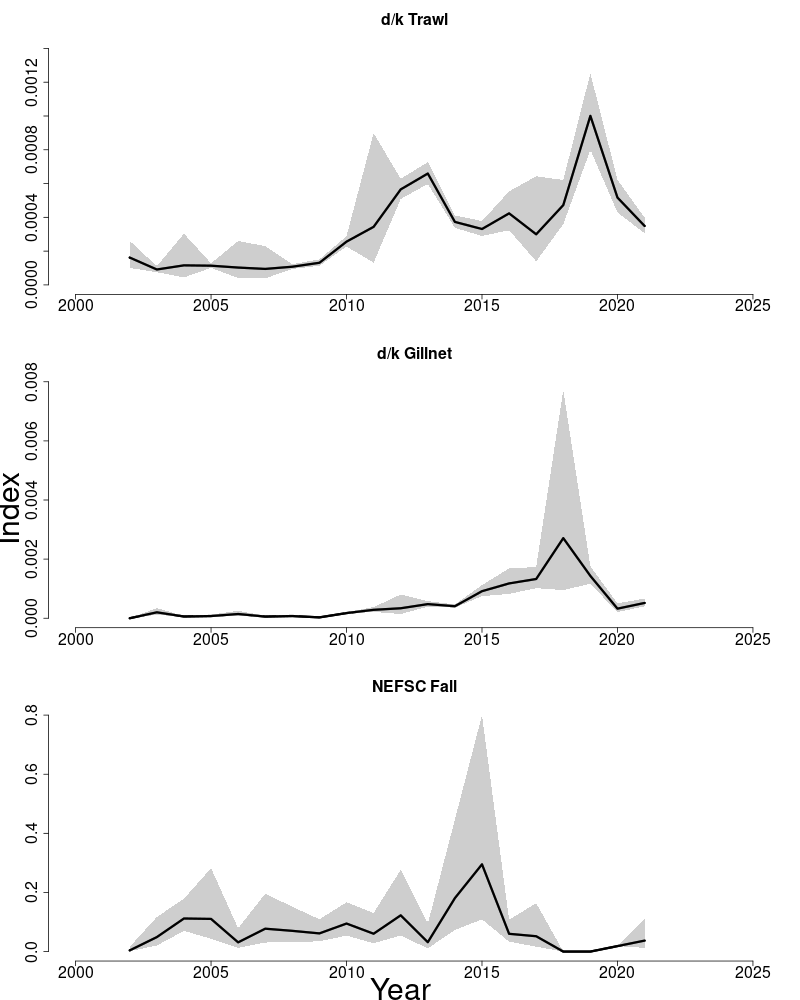
8. WHITE HAKE
This assessment of the white hake (Urophycis tenuis) stock is a Management Track update of the 2019 Operational Assessment (NEFSC 2022) and the last benchmark assessment (NEFSC 2013). Based on the previous assessment the stock was overfished and overfishing was not occurring. This assessment updates commercial fishery catch data, research survey indices of biomass, adds an additional survey, and updates the ASAP assessment model and reference points through 2021. Stock projections have been updated through 2025.
State of Stock: Based on this updated assessment, the white hake (Urophycis tenuis) stock is not overfished and overfishing is not occurring (Figures 29–30). Retrospective adjustments were made to the model results. Spawning stock biomass (SSB) in 2021 was estimated to be 19,497 mt which is 69% of the biomass target (SSBMSY proxy = 28,191; Figure 29). The 2021 fully selected fishing mortality was estimated to be 0.104 which is 65% of the overfishing threshold proxy (FMSY proxy= 0.1605; Figure 30).
| 2012 | 2013 | 2014 | 2015 | 2016 | 2017 | 2018 | 2019 | 2020 | 2021 | |
|---|---|---|---|---|---|---|---|---|---|---|
| Data | ||||||||||
| Commercial discards | 50 | 38 | 33 | 24 | 33 | 36 | 29 | 30 | 31 | 32 |
| Commercial landings | 2,771 | 2,235 | 1,887 | 1,632 | 1,325 | 1,976 | 1,969 | 1,975 | 1,990 | 1,871 |
| Canadian landings | 83 | 43 | 35 | 25 | 39 | 32 | 45 | 24 | 83 | 48 |
| Other landings | 0 | 0 | 0 | 0 | 0 | 0 | 0 | 0 | 0 | 0 |
| Catch for Assessment | 2,903 | 2,316 | 1,955 | 1,680 | 1,396 | 2,043 | 2,044 | 2,029 | 2,104 | 1,951 |
| Model Results | ||||||||||
| Spawning Stock Biomass | 21,919 | 21,867 | 20,783 | 19,143 | 22,186 | 23,673 | 19,359 | 21,276 | 25,059 | 23,670 |
| FFull | 0.15 | 0.12 | 0.1 | 0.09 | 0.07 | 0.09 | 0.11 | 0.1 | 0.09 | 0.09 |
| Recruits (age-1) | 1,991 | 2,502 | 2,720 | 3,082 | 2,521 | 2,757 | 2,975 | 2,630 | 1,912 | 1,740 |
Projections: Short term projections of catch and SSB were derived by sampling from a cumulative distribution function of recruitment estimates from ASAP from 1995–2019. The mean weights-at-age used in the projection are the 2017–2019+2020 averages. The numbers-at-age used to start the projections were adjusted for retrospective bias using age-specific ρ estimates.
| 2019 | 2022 | |
|---|---|---|
| FMSY proxy | 0.1677 | 0.1605 |
| SSBMSY (mt) | 31,828 | 28,191 (22,616–35,424) |
| MSY (mt) | 4,601 | 4,186 (3,345–5,279) |
| Median recruits (age-1) (000s) | 4,471 | 4,232 |
| Overfishing | No | No |
| Overfished | Yes | No |
| Year | Catch (mt) | SSB (mt) | FFull |
|---|---|---|---|
| 2022 | 1,964 | 17,978 (15,553–20,679) | 0.116 |
| Year | Catch (mt) | SSB (mt) | FFull |
| 2023 | 2,650 | 17,679 (15,212–20,216) | 0.1605 |
| 2024 | 2,535 | 17,139 (14,914–19,381) | 0.1605 |
| 2025 | 2,547 | 17,326 (15,360–19,302) | 0.1605 |
Special Comments:
- •
What are the most important sources of uncertainty in this stock assessment? Explain, and describe qualitatively how they affect the assessment results (such as estimates of biomass, F, recruitment, and population projections).
1. Catch-at-age information is not well characterized due to possible mis-identification of species in the commercial and observer data, particularly in early years, low sampling of commercial landings in some years, and sparse discard length data.2. Since the commercial catch is aged primarily with survey age/length keys, there is considerable augmentation required, mainly for ages 5 and older. The numbers-at-age and mean weights-at-age in the catch for these ages may therefore not be well specified.3. White hake may move seasonally into and out of the defined stock area.4. There are no commercial catch-at-age data prior to 1989 and the catchability of older ages in the surveys is very low. This results in a large uncertainty in starting numbers-at-age.5. Since 2003, dealers have been culling extra-large fish out of the large category. However, there was no market category for landings until June 2014. The length compositions are distinct from fish characterized as large and have been identified since 2011. This may bias the age composition of the landings, particularly in 2014 when 2000 of the 5000 large samples were these extra-large fish.
6. A pooled age/length key is used for 1963–1981, fall 2003 survey data as well as the second half of the commercial key, and for the 2020 commercial CAA.
- •
Does this assessment model have a retrospective pattern? If so, is the pattern minor, or major? (A major retrospective pattern occurs when the adjusted SSB or FFull lies outside of the approximate joint confidence region for SSB and FFull
The 7-year Mohn’s ρ, relative to SSB, was 0.31 in the 2019 assessment and was 0.21 in 2021. The 7-year Mohn’s ρ, relative to F, was −0.22 in the 2019 assessment and was −0.17 in 2021. There was a major retrospective pattern for this assessment because the ρ-adjusted estimate of 2021 SSB (SSBρ= 19,497) was outside the approximate 90% confidence regions around SSB (19,894–26,646). A retrospective adjustment was made for both the determination of stock status and for projections of catch in 2023. The retrospective adjustment changed the 2021 SSB from 23,670 to 19,497 and the 2021 FFull from 0.09 to 0.104.
- •
Based on this stock assessment, are population projections well determined or uncertain? If this stock is in a rebuilding plan, how do the projections compare to the rebuilding schedule?
Population projections for white hake are not well determined and projected biomass from the last assessment was near the edge the confidence bounds of the biomass estimated in the current assessment. The rebuilding deadline for this stock is now 2031 and the stock may rebuild.
- •
Describe any changes that were made to the current stock assessment, beyond incorporating additional years of data and the affect these changes had on the assessment and stock status. In the 2022 assessment of white hake, the catch efficiency studies and data were not used because studies were not applicable to roundfish.
Minor changes to the catch-at-age for 2003 and 2015–2018 were made and made little difference to the model. The swept-area adjusted survey values for 2009–2018 were used as well as the bootstrap CVs. This lowered the estimates of SSB over that time period and slightly increased fishing mortality. In addition, one new survey was added to the ASAP model which reduced the retrospective pattern.
- •
If the stock status has changed a lot since the previous assessment, explain why this occurred.
Stock status of white hake has changed from overfished to not overfished for at least two reasons. First, the retrospective pattern was reduced. Second, the biomass reference point was also reduced because of a lower mean recruitment.
- •
Provide qualitative statements describing the condition of the stock that relate to stock status.
The white hake stock shows no truncation of age structure. Estimates of commercial landings and discards have decreased over time.
- •
Indicate what data or studies are currently lacking and which would be needed most to improve this stock assessment in the future.
Age structures collected by the observer program are available and should be aged to augment the survey keys. The additional years of age structures from the ASMFC shrimp survey should also be aged and continue to be collected. There are two bottom longline surveys that should be monitored as the time series gets longer, and the otoliths aged and collected.
- •
Are there other important issues?
None.
8.1. Reviewer Comments: White hake
The 2022 assessment for white hake (Urophycis tenuis) is an update to the 2019 Operational Assessment (NEFSC 2022)1717 NEFSC. 2022. Operational Assessment of 14 Northeast Groundfish Stocks Updated Through 2018. US Dep Commer, NOAA Fisheries, Northeast Fish Sci Cent Ref Doc. 22-06; 227p.CRD22-06 and the last benchmark assessment (NEFSC 2013)1818 NEFSC. 2013. 56th Northeast Regional Stock Assessment Workshop (SAW 56) Assessment Report.US Dep Commer, NOAA Fisheries, Northeast Fish Sci Cent Ref Doc. 13-10; 868p.CRD13-10. This assessment updates commercial fishery catch data, research survey indices of biomass, adds additional surveys, and updates the ASAP assessment model and reference points through 2021. Stock projections have been updated through 2025.
The Panel concluded that the 2022 assessment update for white hake fulfilled the recommendations of the AOP, is technically sufficient to evaluate stock status and provide scientific advice and meets the Terms of Reference for the stock’s assessment. The assessment represents Best Scientific Information Available (BSIA) for this stock for management purposes.
Terms of Reference: White hake
- 1.
Estimate catch from all sources including landings and discards.
This TOR was satisfactorily addressed.
US and Canadian commercial landings and discard data were updated by market category through 2021 with CAMS tables used for 2020–2021. Catch was split by red/white hake market category using proportion by area fished. Market category of extra-large hake was combined with large hake because of a lack of landings.
US discards were estimated using a method like the NEFSC’s Standard Bycatch Reporting Methodology (SBRM) approach by gear type. Longline discards were assumed to be the same Catch-at-Age (CAA) as large-mesh trawl discards, scallop dredge and shrimp trawl discards were the same CAA as small mesh discards and sink gill net discards were the same CAA as landings and discards combined.
The Panel recommends that the SBRM method be used in the next assessment.
- 2.
Evaluate indices used in the assessment (e.g., indices of relative or absolute abundance, recruitment, state surveys, age–length data, etc.).
This TOR was satisfactorily addressed.
Spring and fall tow-specific swept area NEFSC bottom trawl survey indices were updated through 2021 (2020 surveys were not conducted). Additional US survey data were evaluated: the ASMFC shrimp survey (including age and length data) and the NEFSC bottom longline survey. As with other stocks, no 2020 survey data were available except for the fall BLLS. A pooled Age Length Key (ALK) from previous years was used as a proxy for the missing 2020 WAA/CAA.
- 3.
Estimate annual fishing mortality, recruitment and stock biomass (both total and spawning stock) as possible (depending on the assessment method) for the time series using the approved assessment method and estimate their uncertainty. Include retrospective analyses if possible (both historical and within-model) to allow a comparison with previous assessment results and projections, and to examine model fit.
- (a)
Include bridge runs to sequentially document each change from the previously accepted model to the updated model proposed for this peer review.
- (b)
Prepare a backup assessment approach that would serve as an alternative for providing scientific advice to management if the analytical assessment were to not pass review.
This TOR was satisfactorily addressed.
The Base model used here was the final accepted ASAP model from the preceding Operational Assessment of white hake using catch and survey data for 1963–2021. Catches-At-Age (CAA) for 1963–2018 were updated with additional CAA for 2019–2021.The missing 2020 CAA was considered using pooled Age Length keys (no survey ages) with sensitivity to leaving out 2020 CAA. Survey selectivities were set to fully selected at age 3 and other ages were allowed to be estimated, while fishery selectivity was set to full for ages 6–9. The assessment includes two selectivity blocks 1963–1997 and 1998–2021. Shrimp survey and Bottom Longline Survey indices were both evaluated for incorporation into the model.
Other than the introduction of new data, there were only minor changes to the previous assessment. As a result, bridge runs showed negligible differences from the prior assessment.
The Panel recommended that this assessment include the BTS and the shrimp survey, but not the bottom longline survey (BLLS). This should be reevaluated at the next management track assessment when more data is available for both surveys. They may be useful in that both surveys sample age classes which may not be well sampled by the BTS. Consideration should also be given to including the Maine/New Hampshire surveys in the next assessment.
The Panel also recommended that future assessments consider splitting the Albatross and Bigelow BTS time series.
- (a)
- 4.
Re-estimate or update the BRP s as defined by the management track level and recommend stock status. Also, provide qualitative descriptions of stock status based on simple indicators/metrics (e.g., age- and size-structure, temporal trends in population size or recruitment indices, etc.).
This TOR was satisfactorily addressed.
The retrospective pattern improved with adjustments made to the model. Spawning stock biomass (SSB) in 2021 was estimated to be 19,369 mt which is 67% of the biomass target (SSBMSY proxy= 28,039). The 2021 fully selected fishing mortality was estimated to be 0.105 which is 66% of the overfishing threshold proxy (FMSY proxy= 0.1599).
Note that if the missing CAA is left blank in this analysis there were slight differences compared to using a pooled Age Length key. Without the 2020 CAA, the retrospective pattern is better but doesn’t use the length compositions currently in hand.
Based on this updated assessment, the white hake stock is not overfished and overfishing is not occurring.
As with other stocks, the Panel recommends that the pooled age length key be used rather than simply leaving the missing 2020 blank in the reference point calculations.
- 5.
Conduct short-term stock projections when appropriate.
This TOR was satisfactorily addressed.
Short term projections of catch and SSB were derived by sampling from a cumulative distribution function of recruitment estimates from ASAP from 1995–2019. The annual fishery selectivity, maturity ogive, and mean weights at age used in the projection are the most recent 5-year (2017–2021) averages. The numbers-at-age used to start the projections were adjusted for retrospective bias using age-specific ρ estimates.
The estimated catch for 2022 is 1964 mt, which results in catch advice of 2347, 2258, and 2285 mt for 2023–2025, respectively.
- 6.
Respond to any review panel comments or SSC concerns from the most recent prior research or management track assessment.
This TOR was partially addressed, as the assessor presented their research recommendations but not those arising from previous assessment reviews or from the SSC.
This Panel has several research recommendations for potential improvement of the assessment:
- •
The highest priority is to complete aging of collections from various sources with Fishery Observer collections being the most important (it provides missing information on catch). Then, aging of collections from the ME/NH and shrimp surveys should continue.
- •
Evaluate whether there is any difference between fishery and survey Weights-At-Age.
- •
Using a recruitment time series reaching back to 1995 may be inappropriate and NMFS should determine whether there is a more appropriate recruitment stanza for the stock. A change point analysis might be helpful.
- •
At the time of the next Management Track assessment, NMFS should reevaluate use of the shrimp survey data (is the improvement to the retrospective pattern an artifact of adding another index?)
- •
Reevaluate the utility of the Bottom Longline Survey in the assessment once additional years of data are available.
- •
- •
- •
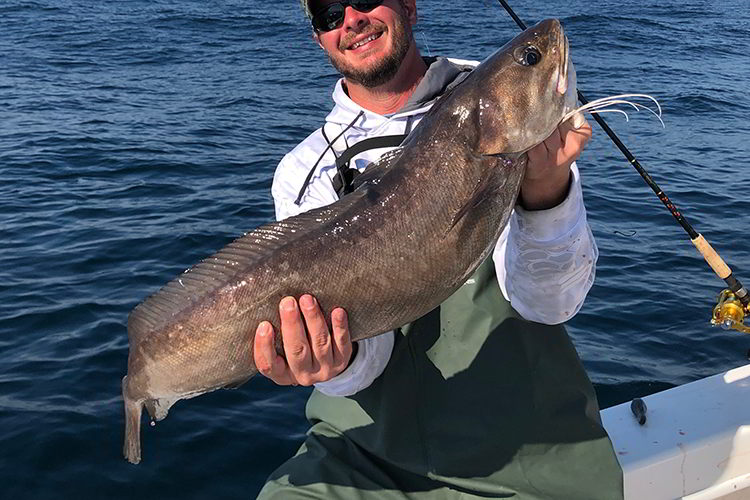
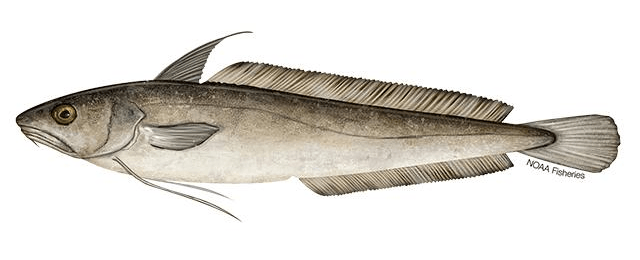
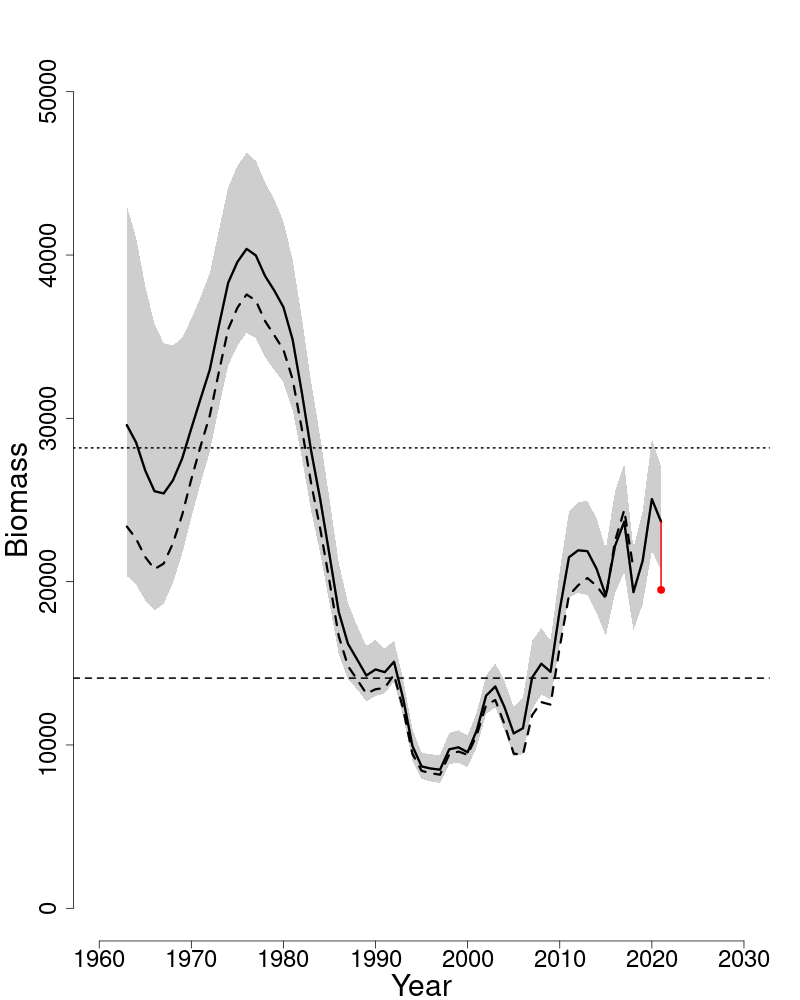
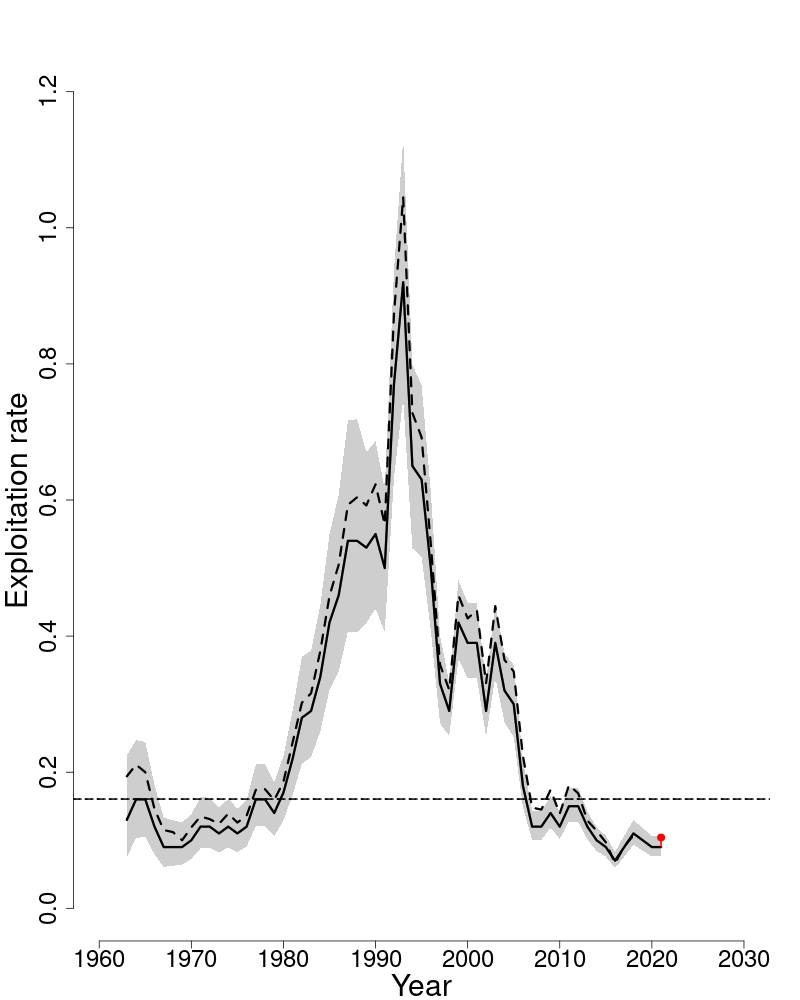
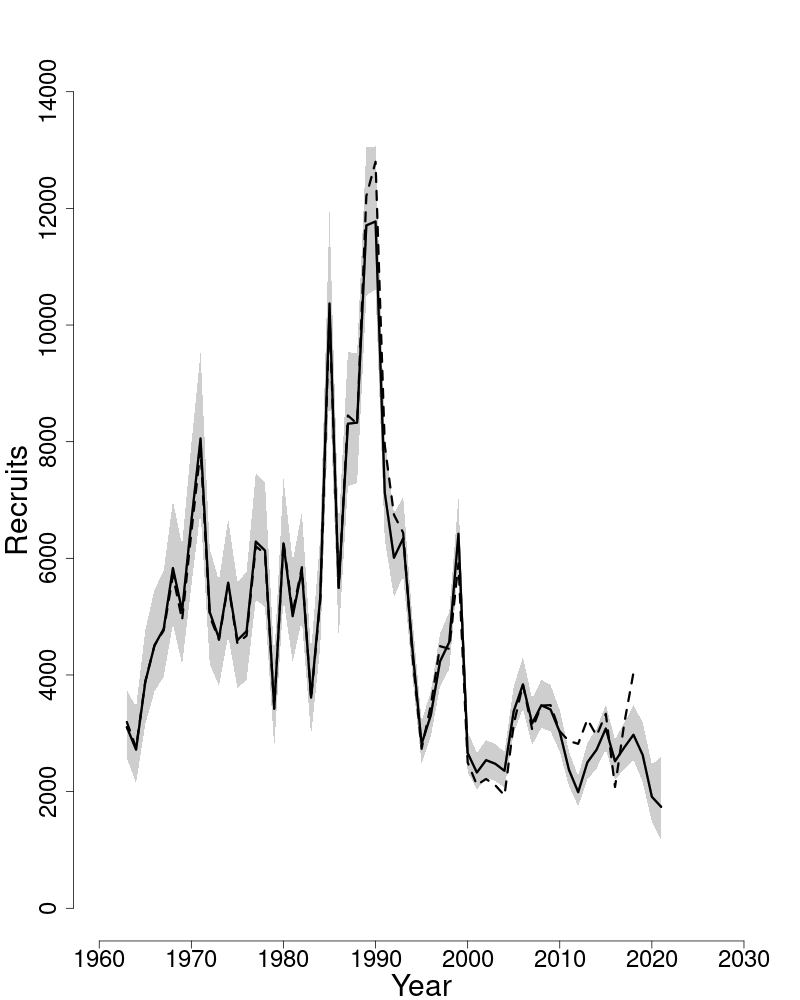
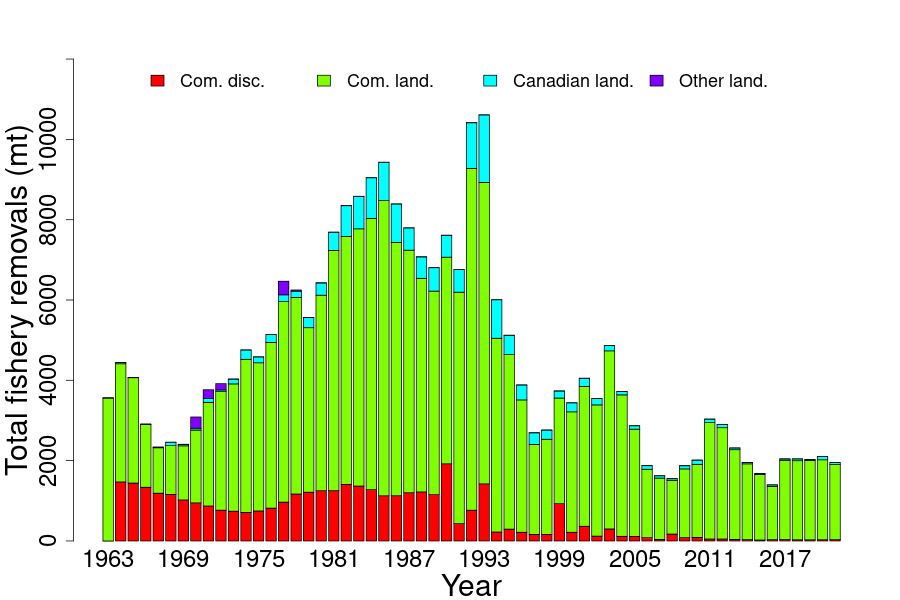
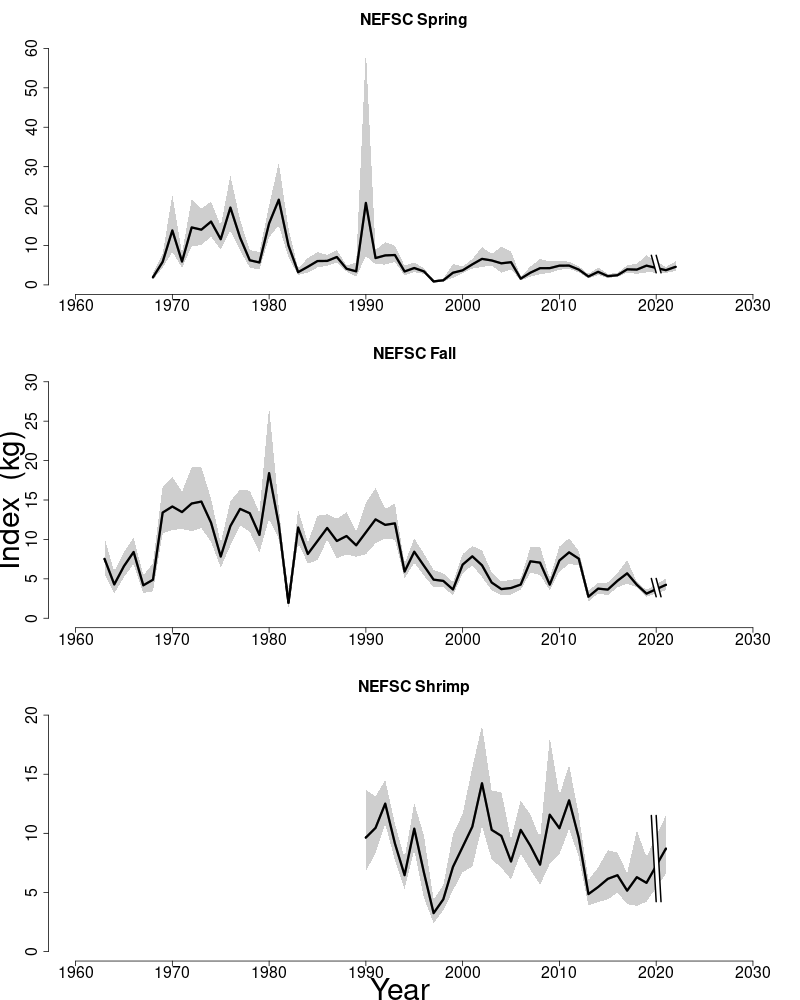
9. NORTHERN MONKFISH
This assessment of the Northern Monkfish (Lophius americanus) stock is a Management Track assessment that updates the existing 2019 ‘Plan B’ assessment. This assessment report provides updated fishery catch data, the averaged NMFS spring and fall survey indices used in the ‘Plan B’ assessment, and the multiplier used to provide catch advice that results from the Ismooth approach used as the ‘Plan B’. Reference points were not applicable and stock status is unknown.
State of Stock: Based on this Management Track assessment, Northern Monkfish (Lophius ameri- canus) stock status is unknown.
| 2012 | 2013 | 2014 | 2015 | 2016 | 2017 | 2018 | 2019 | 2020 | 2021 | |
|---|---|---|---|---|---|---|---|---|---|---|
| Commercial discards | 493 | 459 | 484 | 572 | 734 | 840 | 1,253 | 1,080 | 723 | 802 |
| Commercial landings | 4,081 | 3,355 | 3,434 | 4,086 | 4,723 | 7,105 | 6,009 | 6,084 | 5,587 | 5,121 |
| Catch for Assessment | 4,574 | 3,814 | 3,918 | 4,658 | 5,457 | 7,945 | 7,262 | 7,163 | 6,310 | 5,923 |
| 2019 | 2022 | |
|---|---|---|
| FMSY proxy | NA | NA |
| SSBMSY (mt) | NA | NA |
| MSY (mt) | NA | NA |
| Overfishing | Unknown | Unknown |
| Overfished | Unknown | Unknown |
Projections: Short term projections were not conducted due to lack of an analytical assessment. The catch multiplier resulting from the Ismooth approach equaled 0.829.
Special Comments:
- •
What are the most important sources of uncertainty in this stock assessment? Explain, and describe qualitatively how they affect the assessment results (such as estimates of biomass, F, recruitment, and population projections).
The largest source of uncertainty in this stock assessment is lack of a reliable aging method. Finding a reliable aging method seems unlikely. Monkfish migratory patterns also add uncertainty to the assessment and may complicate interpretation of indices of abundance.
- •
- •
Based on this stock assessment, are population projections well determined or uncertain? If this stock is in a rebuilding plan, how do the projections compare to the rebuilding schedule?
Not applicable.
- •
Describe any changes that were made to the current stock assessment, beyond incorporating additional years of data and the effect these changes had on the assessment and stock status.
The assumed discard mortality rate of monkfish caught using scallop dredges was lowered from 100% to 64%. This change was based on a recent tagging study (Weissman et al., 2021).
- •
If the stock status has changed a lot since the previous assessment, explain why this occurred.
Not applicable.
- •
Provide qualitative statements describing the condition of the stock that relate to stock status.
All indices of abundance reported in the stock assessment, including those not used in the Ismooth approach, showed declines of varying degrees over the past 3–5 years.
- •
Indicate what data or studies are currently lacking and which would be needed most to improve this stock assessment in the future.
The assessment could be most improved through development of an aging method, or exploration of a simpler two-stage, analytical assessment model.
- •
Are there other important issues?
The effects of climate change on monkfish biology and movement are likely to become increasingly important.
9.1. Reviewer Comments: Northern Monkfish
The 2022 assessment for the northern stock of monkfish (Lophius piscatorius) updates the 2019 assessment (NEFSC 2020)1919 NEFSC 2020. Operational assessment of the black sea bass, scup, bluefish, and monkfish stocks, updated through 2018. NEFSC Ref Doc 20-01; 160p.CRD20-01 with additional commercial fishery catch data through 2021, and research survey indices of abundance and area-swept biomass through 2022.
An analytic assessment was not possible due to the lack of a reliable aging methodology. As a result, the ‘Ismooth’ (previously PlanBsmooth; Legault et al., in press)2020 Legault, C.M., J. Wiedenmann, J.J. Deroba, G. Fay, T.J. Miller, E.N. Brooks, R.J. Bell, J.A. Langan, J.M. Cournane, A.W. Jones, and B. Muffley. 2022. Data Rich but Model Resistant: An Evaluation of data-limited methods to manage fisheries with failed age-based stock assessments. Canadian Journal of Fisheries and Aquatic Sciences. CJFAS2022-0045; https://github.com/cmlegault/PlanBsmooth approach used in the 2020 assessment was updated for this management track assessment. This ‘Ismooth’ approach re-scales the NMFS spring and fall BTS by their respective means (i.e., so each time series has mean equal to one) and averages the fall observation in year y with the spring observation in year y+ 1 to create a single time series for analysis. A Loess-smooth is then applied to the combined time series, and a log-linear regression fit to the most recent three years of index predictions from the Loess fit. The slope of the regression provides a direction and rate of change in the indices that is multiplied by recent catch to provide catch advice. However, neither of the 2020 bottom trawl surveys were available. Consequently, the preferred approach was to use a combined spring and fall BTS time series with the missing 2020 observations replaced with the mean of the 2019 and 2021 observations. Using this method, the multiplier was 0.829 in the North.
An ‘Ismooth’ assessment does not allow for the estimation of reference points (i.e., FMSY, and SSBMSY cannot be determined). Therefore, the status of the stock relative to overfishing and being overfished must be unknown.
Short term projections are not possible using the ‘Ismooth’ approach.
The Panel spent considerable time discussing the appropriate term which the multiplier should be applied against: ABC or catch. The former has been the practice since the ‘Ismooth’ approach was first applied to monkfish and moving to catch would result in a major shift in catch advice. Applying the multiplier against the catch would result in a significant decrease in ABC advice. Estimates of area-swept minimum biomass developed from the chain sweep study indicate a high biomass from what is observed in the BTS but follow the same trends. On the other hand, the ‘Ismooth’ approach was designed to be applied to catch and is derived from catch data. Other index methods also are based on catch. Thus, application of the multiplier to catch is more consistent with Ismooth’s design and other index-based methods. Ultimately the group could not reach a consensus decision, though a majority supported the application of the multiplier against catch.
The Panel also considered whether stock status should be considered unknown. Given that the current stock status is based on a failed assessment, and that the ‘Ismooth’ approach does not generate reference points, the Panel strongly recommended listing stock status as unknown.
The Panel had several research recommendations:
- •
Both the shrimp and scallop survey indices should be considered for inclusion in future assessments.
- •
Given the lack of success developing an aging technique, NMFS should not continue to pursue this avenue of research; consider estimating growth through cohort tracking.
- •
Given the lack of growth information on Monkfish, it was recommended the analyst explore a Simple Delay–Difference Model as a potential modeling approach relative to the ‘ Ismooth’ method.
- •
Other Data Limited methods should also be considered for the assessment.
- •
A better understanding of stock structure (beyond North and South) could improve the assessment effort
- •
Reconsider the catchability coefficient of the chain swept estimates and how this applies to separate surveys.
The Panel concluded that the 2022 assessment update for northern stock of monkfish fulfilled the recommendations of the AOP and is technically sufficient to provide scientific advice and meets the Terms of Reference for the stock’s assessment. It does not provide sufficient information to evaluate stock status. The assessment represents Best Scientific Information Available (BSIA) for this stock for management purposes.
References:
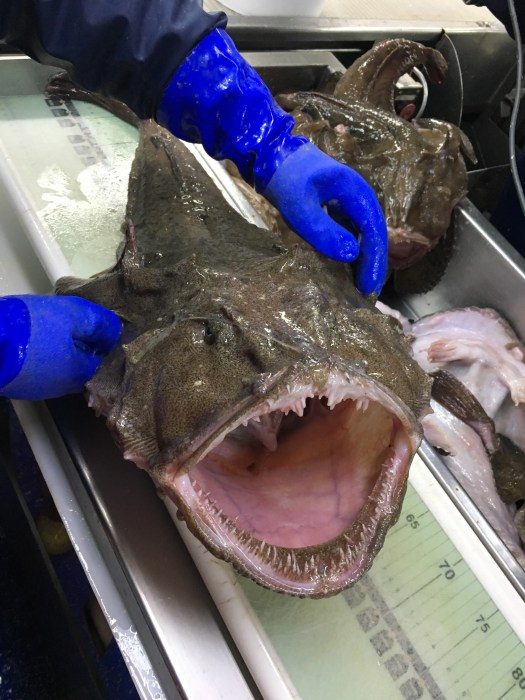
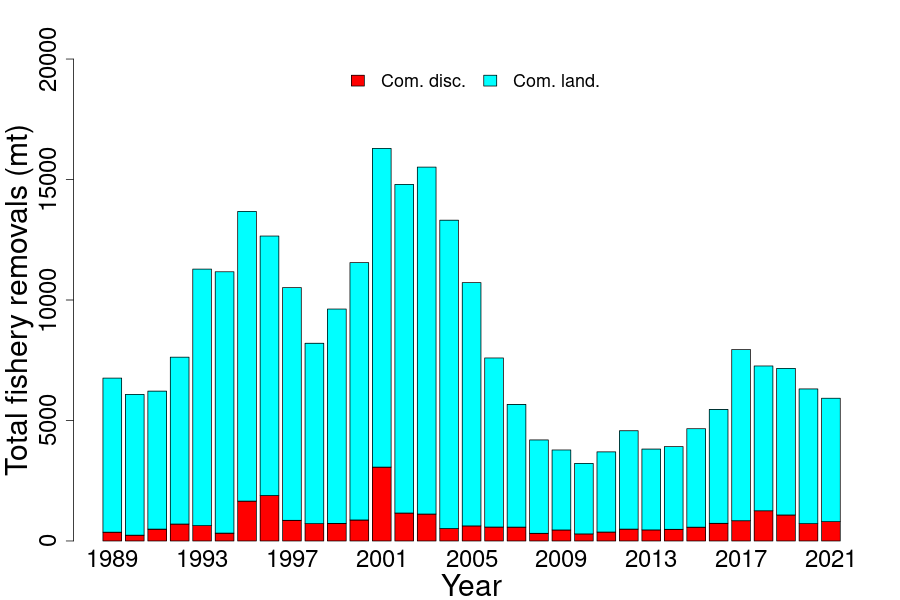
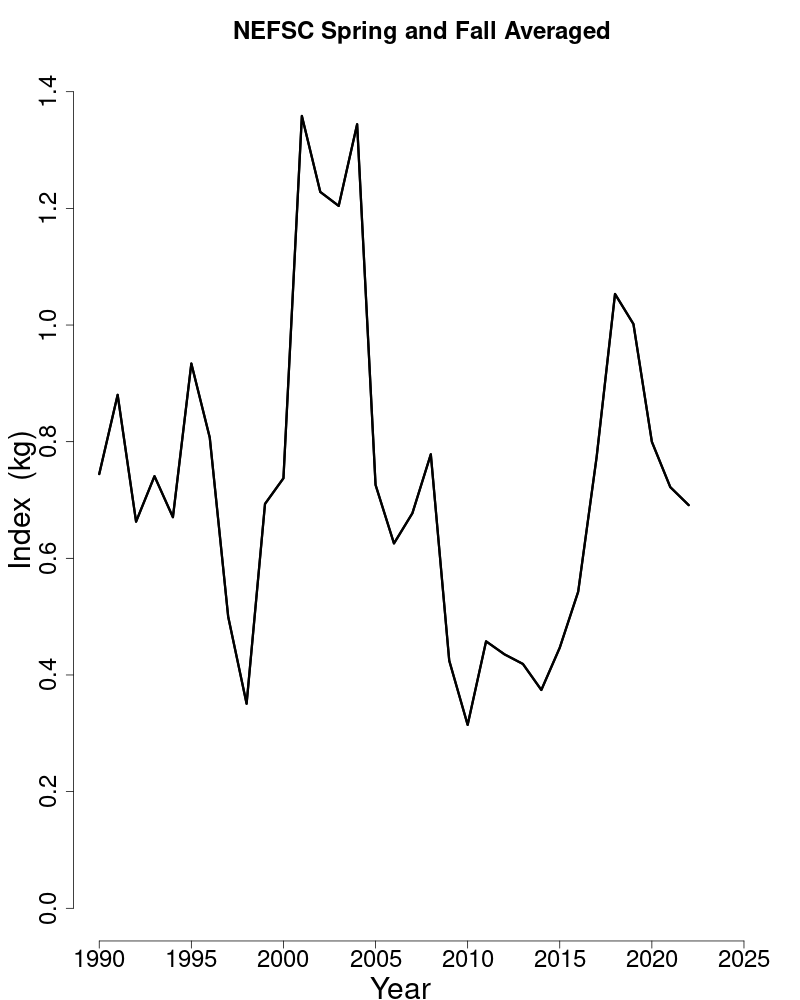
10. SOUTHERN MONKFISH
This assessment of the Southern Monkfish (Lophius americanus) stock is a Management Track assessment that updates the existing 2019 ‘Plan B’ assessment. This assessment report provides updated fishery catch data, the averaged NMFS spring and fall survey indices used in the ‘Plan B’ assessment, and the multiplier used to provide catch advice that results from the ‘Ismooth’ approach used as the ‘Plan B’. Reference points were not applicable and stock status is unknown.
State of Stock: Based on this Management Track assessment, Southern Monkfish (Lophius ameri- canus) stock status is unknown.
| 2012 | 2013 | 2014 | 2015 | 2016 | 2017 | 2018 | 2019 | 2020 | 2021 | |
|---|---|---|---|---|---|---|---|---|---|---|
| Commercial discards | 1,962 | 1,372 | 1,188 | 919 | 2,114 | 3,544 | 3,476 | 3,358 | 2,295 | 2,340 |
| Commercial landings | 5,674 | 5,207 | 5,099 | 4,550 | 4,331 | 3,796 | 4,388 | 4,373 | 2,593 | 2,005 |
| Catch for Assessment | 7,636 | 6,579 | 6,287 | 5,468 | 6,445 | 7,339 | 7,864 | 7,732 | 4,887 | 4,346 |
| 2019 | 2022 | |
|---|---|---|
| FMSY proxy | NA | NA |
| SSBMSY (mt) | NA | NA |
| MSY (mt) | NA | NA |
| Overfishing | Unknown | Unknown |
| Overfished | Unknown | Unknown |
Projections: Short term projections were not conducted due to lack of an analytical assessment. The catch multiplier resulting from the ‘Ismooth’ approach equaled 0.646.
Special Comments:
- •
What are the most important sources of uncertainty in this stock assessment? Explain, and describe qualitatively how they affect the assessment results (such as estimates of biomass, F, recruitment, and population projections).
The largest source of uncertainty in this stock assessment is lack of a reliable aging method. Finding a reliable aging method seems unlikely. Monkfish migratory patterns also add uncertainty to the assessment and may complicate interpretation of indices of abundance.
- •
- •
Based on this stock assessment, are population projections well determined or uncertain? If this stock is in a rebuilding plan, how do the projections compare to the rebuilding schedule?
Not applicable.
- •
Describe any changes that were made to the current stock assessment, beyond incorporating additional years of data and the effect these changes had on the assessment and stock status.
The assumed discard mortality rate of monkfish caught using scallop dredges was lowered from 100% to 64%. This change was based on a recent tagging study (Weissman et al., 2021).
- •
If the stock status has changed a lot since the previous assessment, explain why this occurred.
Not applicable.
- •
Provide qualitative statements describing the condition of the stock that relate to stock status.
All indices of abundance reported in the stock assessment, including those not used in the ‘Ismooth’ approach, showed declines of varying degrees over the past 3–5 years.
- •
Indicate what data or studies are currently lacking and which would be needed most to improve this stock assessment in the future.
The assessment could be most improved through development of an aging method, or exploration of a simpler two-stage, analytical assessment model.
- •
Are there other important issues?
The effects of climate change on monkfish biology and movement are likely to become increasingly important.
10.1. Reviewer Comments: Southern Monkfish
The 2022 assessment for the southern stock of monkfish (Lophius piscatorius) updates the 2019 assessment (NEFSC 2020)2121 NEFSC 2020. Operational assessment of the black sea bass, scup, bluefish, and monkfish stocks, updated through 2018. NEFSC Ref Doc 20-01; 160p.CRD20-01 with additional commercial fishery catch data through 2021, and research survey indices of abundance and area-swept biomass through 2022.
An analytic assessment was not possible due to the lack of a reliable aging methodology. As a result, the ‘Ismooth’ (previously PlanBsmooth; Legault et al., in press)2222 Legault, C.M., J. Wiedenmann, J.J. Deroba, G. Fay, T.J. Miller, E.N. Brooks, R.J. Bell, J.A. Langan, J.M. Cournane, A.W. Jones, and B. Muffley. 2022. Data Rich but Model Resistant: An Evaluation of data-limited methods to manage fisheries with failed age-based stock assessments. Canadian Journal of Fisheries and Aquatic Sciences. CJFAS2022-0045; https://github.com/cmlegault/PlanBsmooth approach used in the 2020 assessment was updated for this management track assessment. This ‘Ismooth’ approach re-scales the NMFS spring and fall BTS by their respective means (i.e., so each time series has mean equal to one) and averages the fall observation in year y with the spring observation in year y+ 1 to create a single time series for analysis. A Loess-smooth is then applied to the combined time series, and a log-linear regression fit to the most recent three years of index predictions from the Loess fit. The slope of the regression provides a direction and rate of change in the indices that is multiplied by recent catch to provide catch advice. However, neither of the 2020 bottom trawl surveys were available. Consequently, the preferred approach was to use a combined spring and fall BTS time series with the missing 2020 observations replaced with the mean of the 2019 and 2021 observations. Using this method, the multiplier was 0.646 in the south.
An ‘Ismooth’ assessment does not allow for the estimation of reference points (i.e., FMSY, and SSBMSY cannot be determined). Therefore, the status of the stock relative to overfishing and being overfished must be unknown.
Short term projections are not possible using the ‘Ismooth’ approach.
The Panel spent considerable time discussing the appropriate term which the multiplier should be applied against: ABC or catch. The former has been the practice since the ‘Ismooth’ approach was first applied to monkfish and moving to catch would result in a major shift in catch advice. Applying the multiplier against the catch would result in a significant decrease in ABC advice. Estimates of area-swept minimum biomass developed from the chain sweep study indicate a high biomass from what is observed in the BTS but follow the same trends. On the other hand, the ‘Ismooth’ approach was designed to be applied to catch and is derived from catch data. Other index methods also are based on catch, rather than ABC. Thus, application of the multiplier to catch is more consistent with Ismooth’s design and other index based methods. Ultimately the group could not reach a consensus decision, though a majority supported the application of the multiplier against catch.
The Panel also considered whether stock status should be considered unknown. Given that the current stock status is based on a failed assessment, and that the ‘Ismooth’ approach does not generate reference points, the Panel strongly recommended listing stock status as unknown.
The Panel had several research recommendations:
- •
Both the shrimp and scallop survey indices should be considered for inclusion in future assessments.
- •
- •
Given the lack of growth information on Monkfish, it was recommended that the analyst explore a Simple Delay–Difference Model as one potential modeling approach in the next research track assessment.
- •
Other Data Limited methods should also be considered for that assessment.
- •
A better understanding of stock structure (beyond the border of Northern and Southern stocks) could improve the assessment effort.
- •
Reconsider the catchability coefficient of the chain swept estimates and how this applies to separate surveys.
The Panel concluded that the 2022 assessment update for southern stock of monkfish fulfilled the recommendations of the AOP and is technically sufficient to provide scientific advice and meets the Terms of Reference for the stock’s assessment. It does not provide sufficient information to evaluate stock status. The assessment represents Best Scientific Information Available (BSIA) for this stock for management purposes.
References:
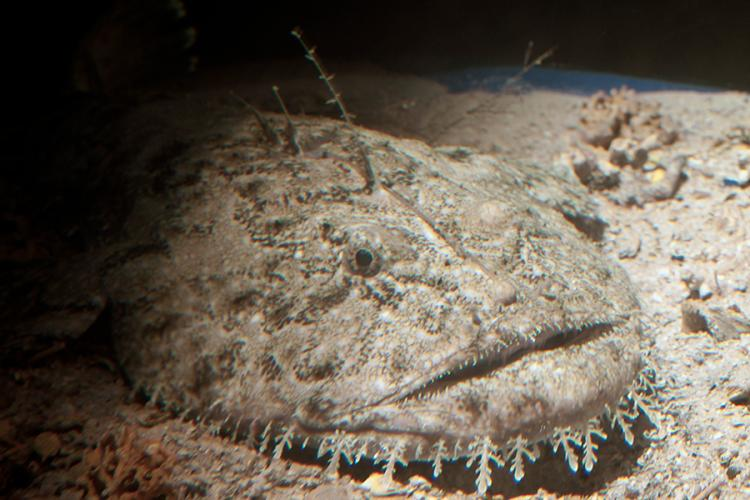
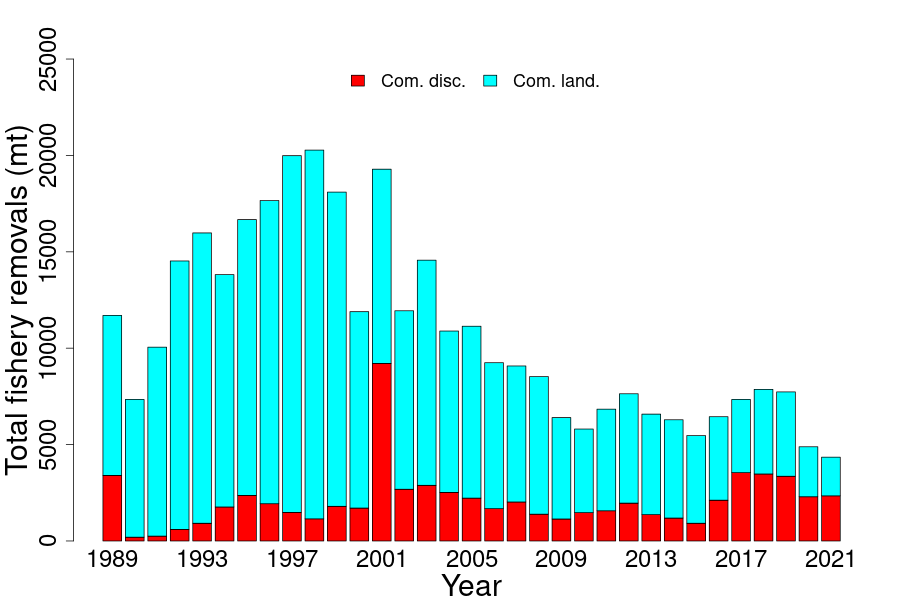
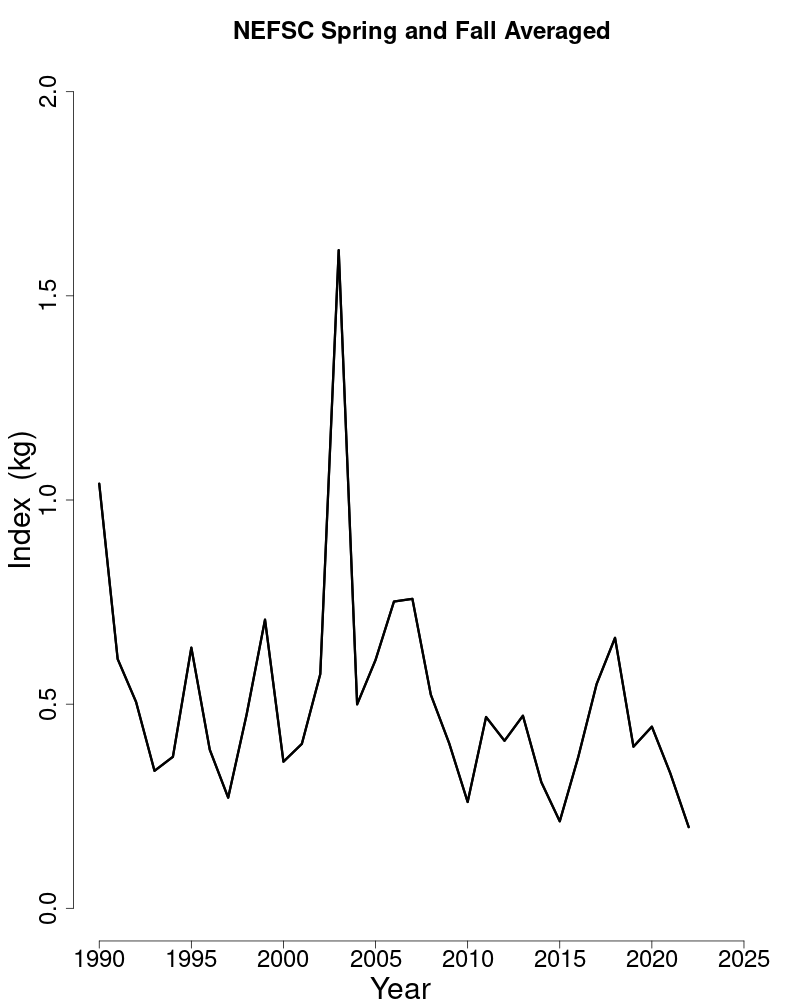
11. OCEAN POUT
This assessment of the ocean pout (Zoarces americanus) stock is a level-1 management track assessment of the existing benchmark assessment (NEFSC 2008). Based on the previous 2020 management track assessment (NEFSC 2022) the stock was overfished, but overfishing was not occurring. This assessment updates commercial fishery catch data, research survey indices of abundance and exploitation ratios through 2021.
State of Stock: Based on this updated assessment, the ocean pout (Zoarces americanus) stock is overfished and overfishing is not occurring (Figures 38–39). Retrospective adjustments were not made to the model results. Biomass proxy (B) in 2021 was estimated to be 0.263 (kg/tow) which is 5% of the biomass target (SSBMSY proxy= 4.94; Figure 38). The 2021 fully selected fishing mortality was estimated to be 0.234 which is 31% of the overfishing threshold proxy (FMSY proxy= 0.76; Figure 39).
| 2012 | 2013 | 2014 | 2015 | 2016 | 2017 | 2018 | 2019 | 2020 | 2021 | |
|---|---|---|---|---|---|---|---|---|---|---|
| Data | ||||||||||
| Commercial landings | 0 | 0 | 0 | 0 | 0 | 0 | 0 | 0 | 0 | 0 |
| Commercial discards | 94 | 68 | 74 | 63 | 49 | 42 | 41 | 79 | 18 | 61 |
| Other landings | 0 | 0 | 0 | 0 | 0 | 0 | 0 | 0 | 0 | 0 |
| Catch for Assessment | 94 | 68 | 74 | 63 | 49 | 42 | 41 | 79 | 18 | 61 |
| Model Results | ||||||||||
| NEFSC 3-yr average spring survey | 0.317 | 0.37 | 0.301 | 0.319 | 0.223 | 0.232 | 0.182 | 0.175 | 0.285 | 0.263 |
| Exploitation Ratio | 0.296 | 0.185 | 0.248 | 0.197 | 0.222 | 0.183 | 0.224 | 0.455 | 0.062 | 0.234 |
| 2020 | 2022 | |
|---|---|---|
| FMSY proxy | 0.76 | 0.76 |
| SSBMSY (kg/tow) | 4.94 | 4.94 |
| MSY (mt) | 3,754 | 3,754 |
| Overfishing | No | No |
| Overfished | Yes | Yes |
Special Comments:
- •
What are the most important sources of uncertainty in this stock assessment? Explain, and describe qualitatively how they affect the assessment results (such as estimates of biomass, F, recruitment, and population projections).
An important source of uncertainty is the stock has not responded to low catch as expected.
- •
Does this assessment model have a retrospective pattern? If so, is the pattern minor, or major? (A major retrospective pattern occurs when the adjusted SSB or FFull lies outside of the approximate joint confidence region for SSB and FFull).
The exploitation ratio does not allow estimation of a retrospective pattern.
- •
Based on this stock assessment, are population projections well determined or uncertain? If this stock is in a rebuilding plan, how do the projections compare to the rebuilding schedule?
Projections are not available for the exploitation ratio.
- •
Describe any changes that were made to the current stock assessment, beyond incorporating additional years of data and the effect these changes had on the assessment and stock status.
The time series of Bigelow indices was recalculated using station-specific swept areas. Supplemental Figure 6 (seeSASINF ) was presented to the Assessment Oversight Panel (AOP) on May 23, 2022; the AOP agreed that the differences were minor.The data source for commercial landings changed to the Catch Accounting and Monitoring System (CAMS) beginning in 2020. However, given the no possession limit, the AOP agreed that this is not an issue.
- •
If the stock status has changed a lot since the previous assessment, explain why this occurred.
Stock status has not changed since the previous assessment.
- •
Provide qualitative statements describing the condition of the stock that relate to stock status.
Discards comprise most of the catch since the no possession regulation was implemented in May 2010. The NEFSC survey indices remain at near-record low levels; there are few large fish in the population. The ocean pout stock remains in poor condition.
- •
Indicate what data or studies are currently lacking and which would be needed most to improve this stock assessment in the future.
The assessment could be improved with studies that explore why this stock is not rebuilding as expected.
- •
Are there other important issues?
The 2020 spring NEFSC survey was treated as missing for this assessment. Thus, the moving average was calculated as the mean of the 2021 and 2022 survey indices. It is worth noting that a similar approach is taken at the start of the time series, where the moving average for 1968 is calculated as the mean of the 1968 and 1969 survey indices.The Assessment Oversight Panel (AOP) determined that the 2022 management track assessment for ocean pout would be a Level 1 direct delivery on May 23, 2022. Shortly afterward, while reviewing the report from the October 2020 NEFMC SSC meeting, this statement was noted “The SSC had a thorough discussion about ocean pout, and contemplated stating that the OFL was unknown but decided not to do this. The reference point used for this stock (FMSY= 0.76) was set several assessment cycles back and, as such, probably needs to be reexamined to determine whether it is still applicable”.The Population Dynamics Branch convened a brainstorming session on July 6, 2022 to address this issue. It was concluded that:- Survey indices for ocean pout remain at, or near, record low levels, and that since the implementation of the no possession limit in May 2010, catch has consisted almost exclusively of discards.- In spite of the no possession limit, stock size has not increased, suggesting that this stock may have entered a depensatory state.- There is no clear alternative to the current reference point proxies, which are based upon survey biomass trends and the exploitation history.- The current reference points should remain in place until more justifiable alternatives can be developed.- More generally, removal of biological reference points (BRPs) is not desirable unless there is a clear justification on why the BRPs are no longer appropriate for stock status determination.
11.1. Reviewer Comments: Ocean pout
Ocean pout was not peer reviewed in fall of 2022.
References:
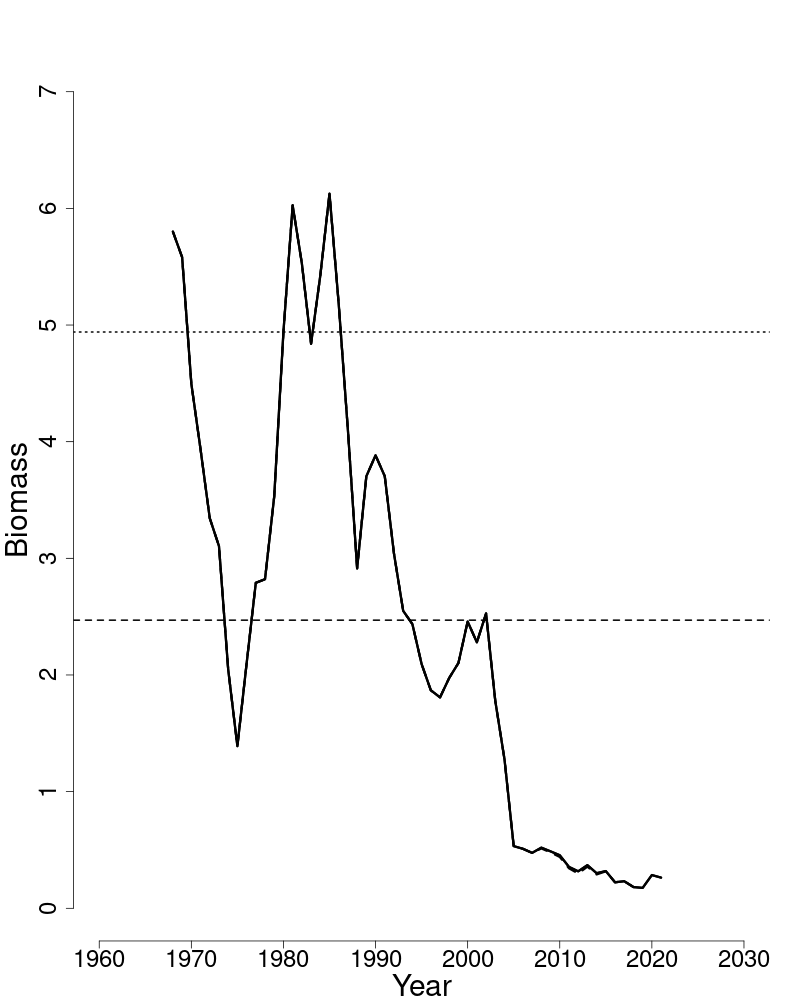
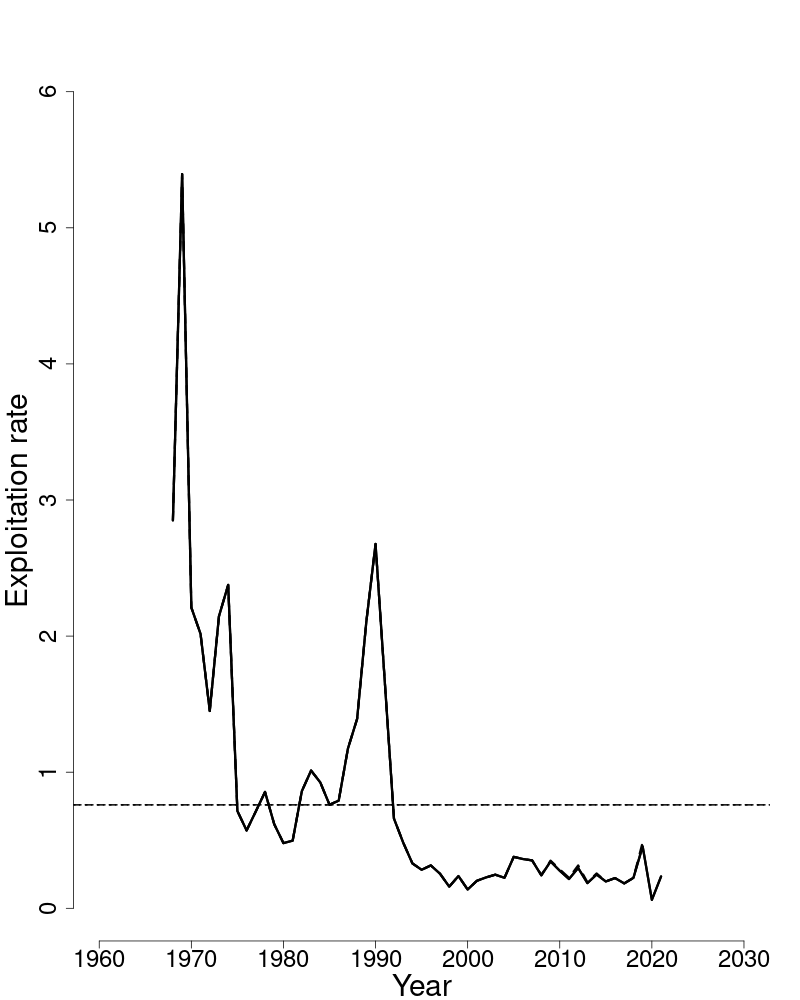
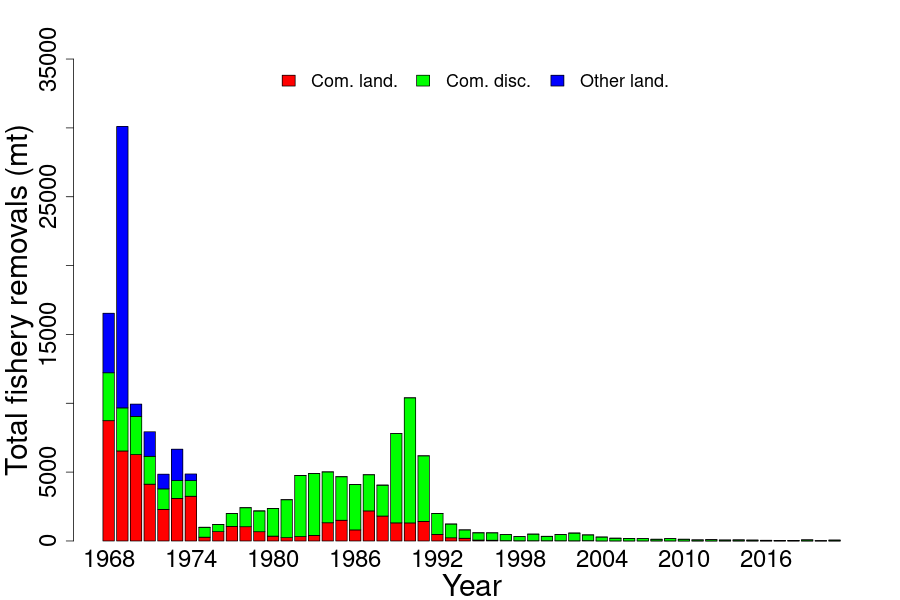
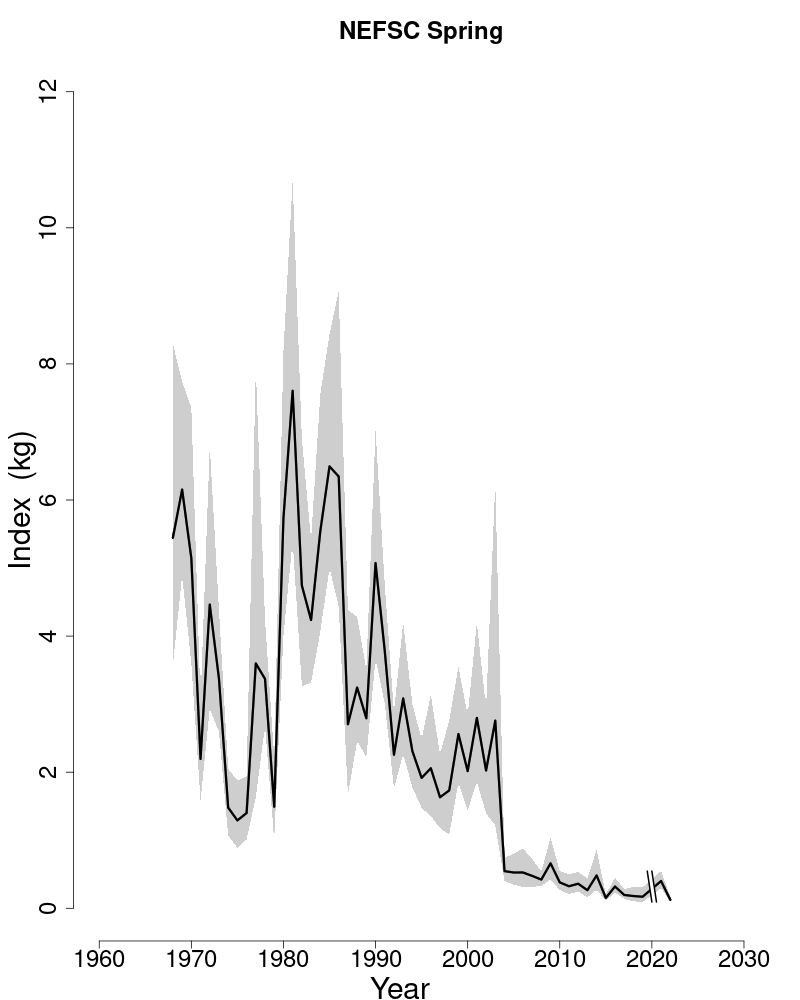
12. AMERICAN PLAICE
This assessment of the American plaice (Hippoglossoides platessoides) stock is a Level 2 Management Track assessment of the existing 2022 research track assessment (NEFSC 2022). Based on the previous assessment the stock was not overfished and overfishing is not occurring. This assessment updates commercial fishery catch data, research survey indices of abundance, and the analytical WHAM assessment model and reference points through 2021. Additionally, stock projections have been updated through 2025.
State of Stock: Based on this Management Track assessment, the American plaice (Hippoglossoides platessoides) stock is not overfished and overfishing is not occurring (Figures 42–43). Retrospective adjustment patterns were minor and retrospective adjustments for terminal year estimates were not needed. Spawning stock biomass (SSB) in 2021 was estimated to be 18,809mt, corresponding to 99% of the biomass target (SSBMSY proxy= 19,051; Figure 42). The 2021 fully selected fishing mortality was estimated to be 0.045, corresponding to 11% of the overfishing threshold proxy (FMSY proxy= 0.414; Figure 43).
| 2012 | 2013 | 2014 | 2015 | 2016 | 2017 | 2018 | 2019 | 2020 | 2021 | |
|---|---|---|---|---|---|---|---|---|---|---|
| Data | ||||||||||
| Commercial landings | 1,462 | 1,297 | 1,239 | 1,231 | 1,009 | 1,134 | 1,087 | 970 | 594 | 632 |
| Commercial discards | 302 | 168 | 92 | 86 | 108 | 102 | 109 | 78 | 68 | 69 |
| Total catch | 1,765 | 1,465 | 1,331 | 1,317 | 1,117 | 1,235 | 1,196 | 1,048 | 662 | 701 |
| Model Results | ||||||||||
| Spawning Stock Biomass | 26,478 | 23,844 | 30,474 | 35,146 | 43,867 | 46,479 | 43,085 | 29,540 | 22,124 | 18,809 |
| FFull | 0.065 | 0.061 | 0.046 | 0.045 | 0.033 | 0.031 | 0.029 | 0.039 | 0.033 | 0.045 |
| Recruits (age-1) | 50,075 | 71,522 | 108,274 | 29,879 | 54,799 | 15,927 | 65,028 | 43,527 | 60,999 | 79,235 |
Projections: Short-term projections were conducted in the WHAM model, which propagates uncertainty in the recruitment and survival processes. For projection specifications, the NEFMC Groundfish Plan Development Team supplied an interim catch estimate for 2022. The annual fishery selectivity, maturity ogive, and mean weights-at-age used in the projections represent the most recent 5-year averages, following the decisions made at the 2022 research track. The stock is projected to remain above the overfished threshold throughout the short-term projection period.
| 2022 research track | 2022 | |
|---|---|---|
| FMSY proxy | 0.43 | 0.41 |
| SSBMSY (mt) | 19,268 | 19,051 (15,073–24,080) |
| MSY (mt) | 6492 | 6203 (4891–7867) |
| Median recruits (age-1) (000s) | 51,270 | 51,987 |
| Overfishing | No | No |
| Overfished | No | No |
| Year | Catch (mt) | SSB (mt) | FFull |
|---|---|---|---|
| 2022 | 653 | 21529 (14381–32231) | 0.036 |
| Year | Catch (mt) | SSB (mt) | FFull |
| 2023 | 7316 | 22536 (14241–35663) | 0.414 |
| 2024 | 6670 | 20324 (11898–34718) | 0.414 |
| 2025 | 6105 | 18298 (10040–33349) | 0.414 |
Special Comments:
- •
What are the most important sources of uncertainty in this stock assessment? Explain, and describe qualitatively how they affect the assessment results (such as estimates of biomass, F, recruitment, and population projections).
The most important source of uncertainty in this assessment is in the commercial landings age samples available for 2020 and 2021. The initial application of the 2020 and 2021 commercial landed age samples resulted in a significant decrease in fish weights-at-age that could not be explained biologically (i.e., cohort shrinkage). Inspection of growth data (i.e., the age-length keys) showed evidence of skewness in the length-at age distribution, particularly in 2021. There is very little confidence that the age samples from the commercial landings for 2020 and 2021 are representative of the landed catch as it may relate to a sampling issue. For the purpose of this assessment, the 2019 age samples were used to characterize the age composition of the commercial landed catch data for both 2020 and 2021. Given the decadal growth pattern in American plaice, this alternative approach to characterizing the age composition for the last two years of landings time series for the assessment is reasonably justified.
- •
Does this assessment model have a retrospective pattern? If so, is the pattern minor, or major? (A major retrospective pattern occurs when the adjusted SSB or FFull lies outside of the approximate joint confidence region for SSB and FFull).
The 7-year Mohn’s ρ, relative to SSB, was −0.023 in the 2022 research track assessment and 0.084 in 2021 for the current Management Track assessment. The 7-year Mohn’s ρ, relative to F, was 0.031 in the 2022 research track assessment and −0.065 in 2021 for the current Management Track assessment. The retrospective pattern for this assessment was considered to be minor because the ρ-adjusted estimates of 2021 SSB (SSBρ= 17354) and 2021 F (Fρ= 0.048) were within the approximate 95% confidence intervals around SSB (13,229–26,742) and F (0.029–0.071). Consequently, a retrospective adjustment of spawning stock biomass or fishing mortality in 2021 was not required.
- •
Based on this stock assessment, are population projections well determined or uncertain? If this stock is in a rebuilding plan, how do the projections compare to the rebuilding schedule?
Population projections for American plaice are well determined. The stock is not in a rebuilding plan.
- •
Describe any changes that were made to the current stock assessment, beyond incorporating additional years of data and the effect these changes had on the assessment and stock status.
The commercial landings changed to the Catch Accounting and Monitoring System (CAMS) beginning in 2020. Supplementary information was presented to the Assessment Oversight Panel (AOP) on August 3rd, 2022; the AOP concurred that there were no notable differences between the AA tables and CAMS. Additionally, the input data for the research track WHAM model were revised to address two issues. The first was to correct for the appropriate survey timing for spring and fall NEFSC survey indices. Second, the mapping of the weights-at-age matrices to the correct survey index was also revised to match the correct survey. Bridge model runs were conducted and the impacts of these changes on model results were inconsequential.
- •
If the stock status has changed a lot since the previous assessment, explain why this occurred.
The stock status of American plaice has not changed since the previous assessment (NEFSC 2022).
- •
- •
Indicate what data or studies are currently lacking and which would be needed most to improve this stock assessment in the future.
The peer-review panel from the 2022 research track identified a number of research recommendations, the most important of which is to explore the availability of observer age samples for characterizing the age composition of commercial discards. The current approach uses survey age-length keys. Recent communication with the NEFSC age and growth lab indicated there are some archived observer age samples but the number of samples appears to be very low.
- •
Are there other important issues?
As indicated earlier, the commercial landings age samples are a source of uncertainty in this assessment. Future evaluation of these samples is warranted to determine how best to use this information in future assessments. Supplementary material is available on the Stock Assessment Supplementary Information website (SASINF ).
12.1. Reviewer Comments: American plaice
The 2022 assessment for American plaice (Hippoglossoides platessoides) is the Management Track assessment resulting from the 2022 Research Track assessment (NEFSC 2022)2323 Northeast Fisheries Science Center (In Progress). Report of the 2022 American plaice Research Track Assessment working group. Available at: SASINF.AmPlaiceWG. This WHAM assessment updates commercial fishery catch data, research survey indices of abundance, and reference points through 2021. Stock projections have been updated through 2025.
Retrospective patterns were minor and retrospective adjustments for terminal year estimates were not needed. Spawning stock biomass in 2021 was estimated to be 18,809 mt, corresponding to 99% of the biomass target (SSBMSY proxy= 19,051mt). The 2021 fully selected fishing mortality was estimated to be 0.045, corresponding to 11% of the overfishing threshold proxy (FMSY proxy= 0.414).
Based on this management track assessment, the stock was not overfished and overfishing was not occurring.
Short-term projections were conducted in the WHAM model, which propagates uncertainty in the recruitment and survival processes. The annual fishery selectivity, maturity ogive, and mean weights-atage used in the projections represent the most recent 5-year averages, following the decisions made at the 2022 research track. The stock is projected to remain above the overfished threshold throughout the short-term projection period.
The estimated catch for 2022 is 653 mt, which results in catch advice of 7316, 6670, and 6105 mt for 2023–2025, respectively.
The Panel focused much of their discussion on the choice of WAA in both the base model and the projections. Both the 2020 and 2021 catch WAA showed steep declines from the 2019 data. These declines were sufficiently large to cast doubt on the data. Various explanations were provided for the observed decrease of WAA, none of which could be easily resolved. The analyst considered several approaches to the analysis including using the observed WAA, using no WAA for the two years, and substituting 2019 WAA for the 2020–2021 WAA. Ultimately, the best solution appeared to be the latter. After considerable discussion, the Panel recommended that the 2019 WAA be used for both the base WHAM model and the projections.
The Panel also recommended that the cause of this phenomena be thoroughly reviewed. If this is a result of inadequate or biased Port Sampling of landings, it is an example of the problems that inadequate sampling will introduce in future assessments for this and other stocks. Here it appears to make the strong 2013 cohort very difficult to track.
The Panel endorses several of the Research Track recommendations:
- •
Exploration of archived observer otolith samples for characterizing age composition of discards
- •
Investigation of approaches to compare models with and without environmental covariates.
- •
Investigation of alternative estimates of natural mortality
The Panel concluded that the 2022 assessment update for American plaice fulfilled the recommendations of the AOP, is technically sufficient to evaluate stock status and provide scientific advice and meets the Terms of Reference for the stock’s assessment. The assessment represents Best Scientific Information Available (BSIA) for this stock for management purposes.
References:
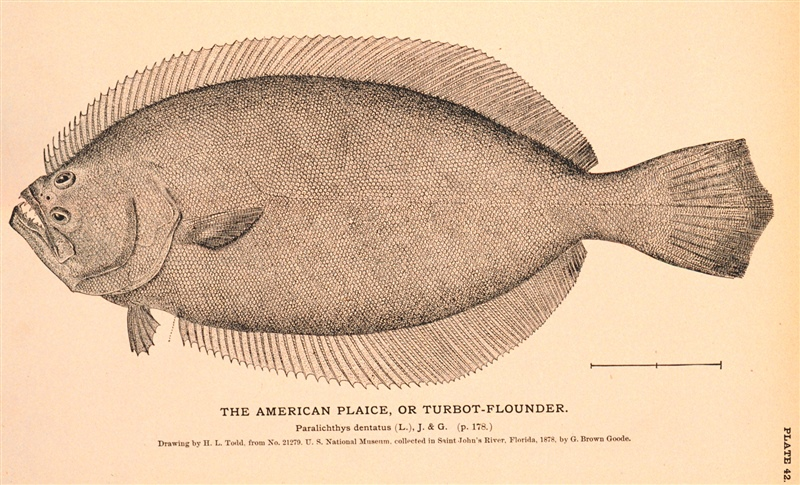
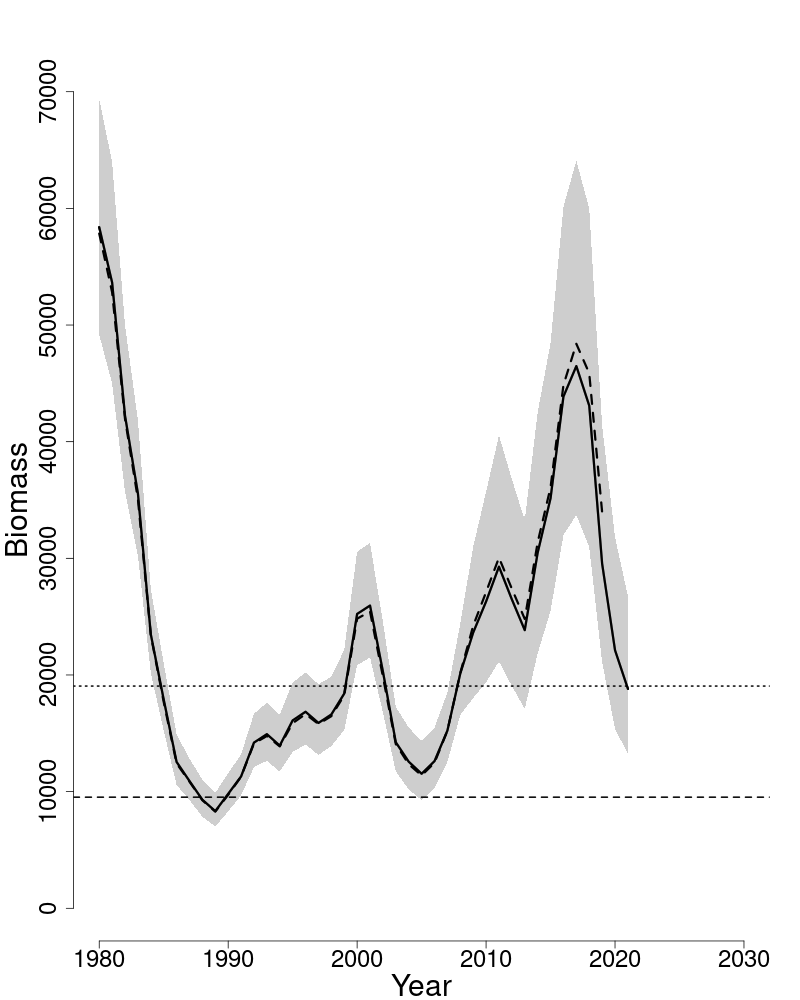
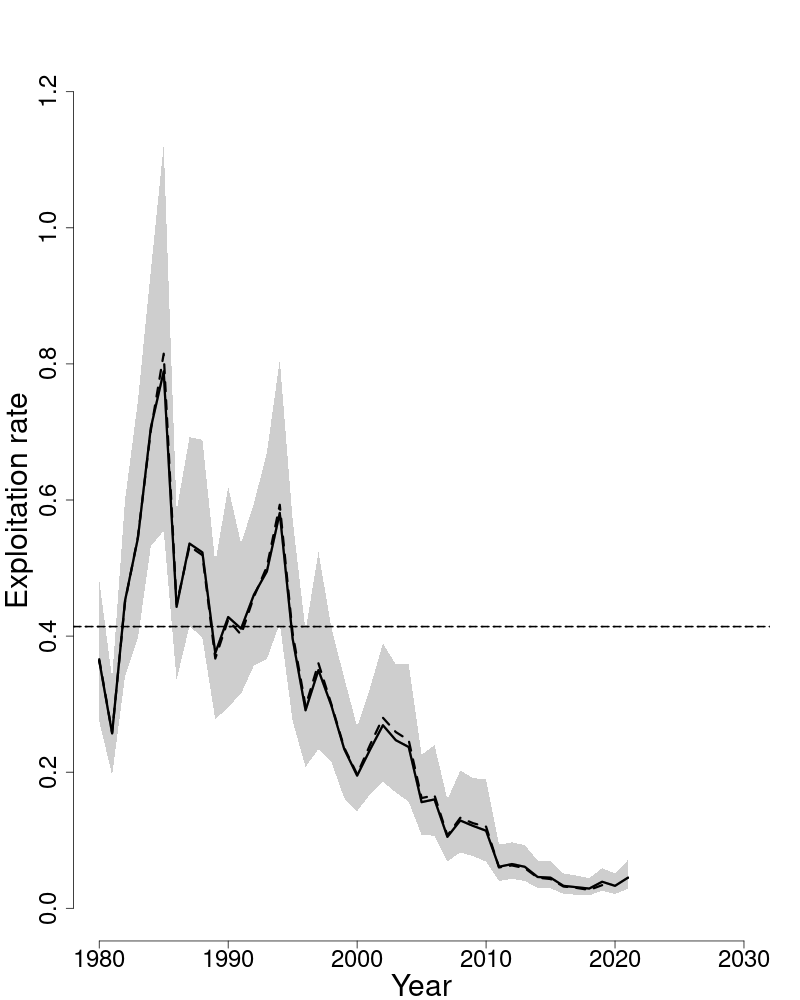
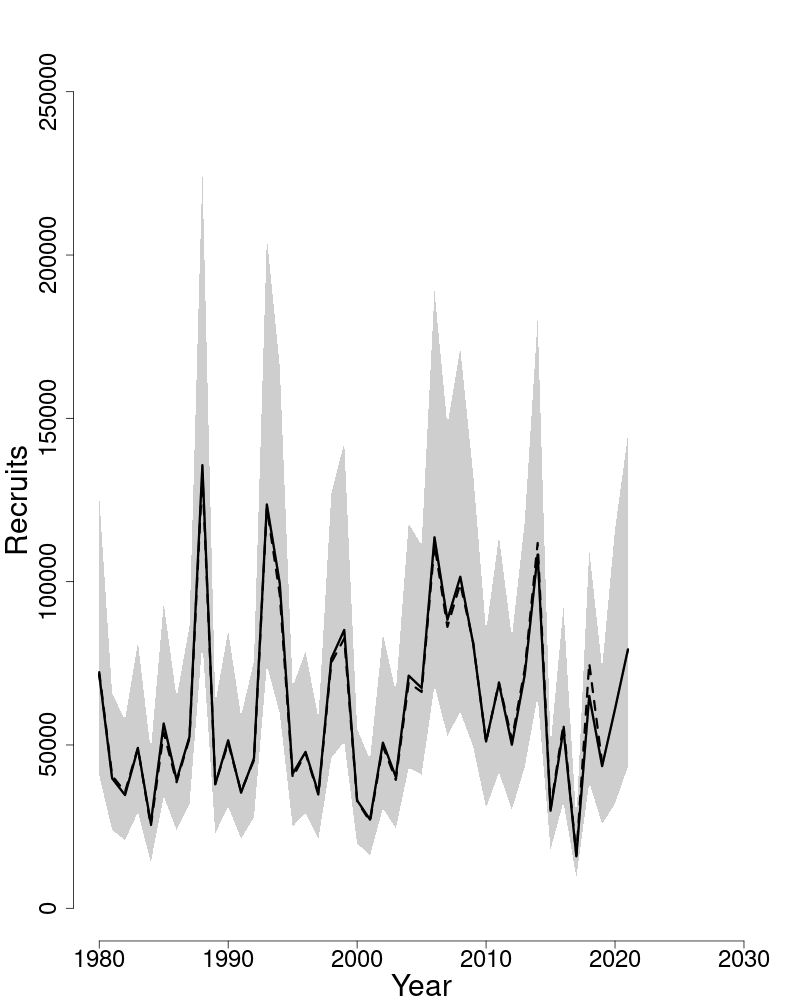
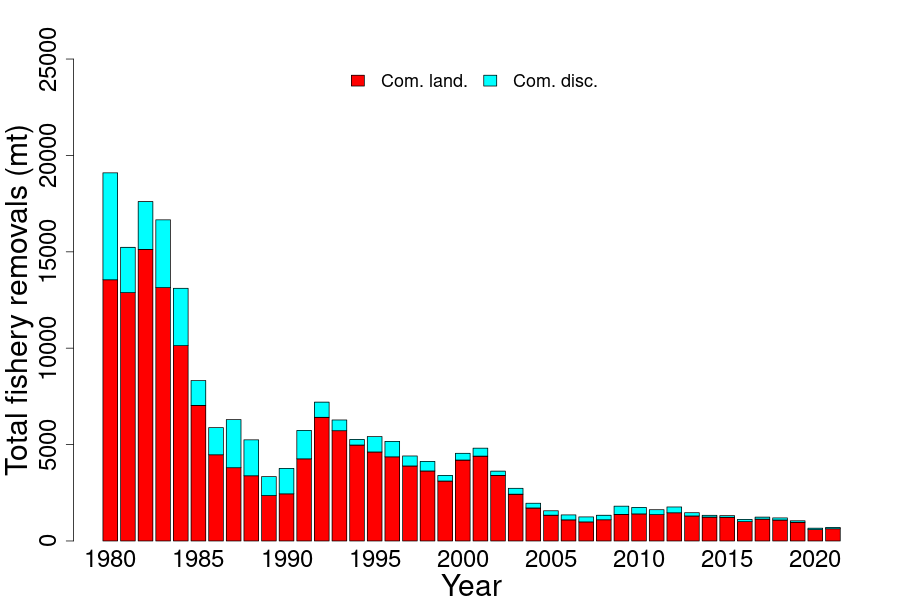

13. POLLOCK
This assessment of the pollock (Pollachius virens) stock is a Level 3 Management Track assessment, updating the 2019 Operational Assessment (NEFSC 2022). This assessment updates commercial and recreational fishery catch data, research survey indices of abundance, the ASAP analytical models, and biological reference points through 2021. Additionally, stock projections have been updated through 2025. In what follows, there are two population assessment models brought forward from the 2019 Operational Assessment: the base model (dome-shaped survey selectivity), which is used to provide management advice; and the flat sel sensitivity model (flat-topped survey selectivity), which is included for the sole purpose of demonstrating the sensitivity of assessment results to survey selectivity assumptions. The most recent benchmark assessment of the pollock stock was in 2010 as part of the 50th Stock Assessment Review Committee (SARC 50; NEFSC 2010), which includes a full description of the model formulations.
State of Stock: The pollock (Pollachius virens) stock is not overfished and overfishing is not occurring (Figures 47–48). No retrospective adjustments were made to the model results. Spawning stock biomass (SSB) in 2021 was estimated to be 175,573 mt under the base model and 85,109 mt under theflat sel sensitivity model which is 191% and 150% (respectively) of the biomass target, an SSBMSY proxy of SSB at F40%SPR (92,130 mt and 56,817 mt; Figure 47). The 2021 age 5 to 7 average fishing mortality (F) was estimated to be 0.052 under the base model and 0.092 under the flat sel sensitivity model, which is 22% and 39% (respectively) of the overfishing threshold, an FMSY proxy of F40%SPR (0.235 and 0.237; Figure 48).
| 2014 | 2015 | 2016 | 2017 | 2018 | 2019 | 2020 | 2021 | |
|---|---|---|---|---|---|---|---|---|
| Data | ||||||||
| Commercial landings | 4,545 | 3,046 | 2,582 | 3,249 | 3,078 | 3,167 | 3,527 | 3,369 |
| Commercial discards | 135 | 155 | 97 | 49 | 70 | 154 | 174 | 99 |
| Recreational landings | 1,504 | 750 | 1,028 | 1,239 | 684 | 359 | 766 | 327 |
| Recreational discards | 2,429 | 2,186 | 1,519 | 2,059 | 940 | 584 | 765 | 728 |
| Catch for Assessment | 8,613 | 6,138 | 5,226 | 6,597 | 4,772 | 4,265 | 5,231 | 4,522 |
| Model Results (base) | ||||||||
| Spawning Stock Biomass | 159022 | 180571 | 183767 | 200551 | 207766 | 177261 | 187710 | 175573 |
| FAVG | 0.104 | 0.066 | 0.051 | 0.056 | 0.038 | 0.036 | 0.047 | 0.052 |
| Recruits (age-1) | 42577 | 29008 | 19866 | 19446 | 20370 | 18831 | 28368 | 12833 |
| Model Results (flat sel sensitivity) | ||||||||
| Spawning Stock Biomass | 65427 | 75376 | 80568 | 89402 | 92958 | 83941 | 90307 | 85109 |
| FAVG | 0.211 | 0.133 | 0.101 | 0.11 | 0.073 | 0.066 | 0.086 | 0.092 |
| Recruits (age-1) | 25325 | 17450 | 12108 | 12098 | 12924 | 12154 | 18413 | 8270 |
| 2019 base | 2019 flat sel sensitivity | base | flat sel sensitivity | |
|---|---|---|---|---|
| FMSY | 0.272 | 0.260 | 0.235 | 0.237 |
| SSBMSY (mt) | 124,639 | 70,721 | 92,130 (76,146–112,774) | 56,817 (46,945–69,163) |
| MSY (mt) | 19,856 | 12,007 | 12,519 (9,775–16,548) | 8,238 (6,489–10,695) |
| Median recruits (age-1) (000s) | 25,312 | 14,503 | 20,390 | 12,578 |
| Overfishing | No | No | No | No |
| Overfished | No | No | No | No |
Projections: Short term projections of median total fishery yield and spawning stock biomass for pollock were conducted based on a harvest scenario of fishing at an FMSY proxy of F40%SPR between 2023 and 2025. Catch in 2022 has been estimated at 3,959 (mt). Recruitments were sampled from a cumulative distribution function derived from ASAP estimated age-1 recruitment between 1970 and 2019. Recruitments in 2020 and 2021 were not included due to uncertainty in those estimates. The annual fishery selectivity, natural mortality, maturity ogive, and mean weights used in projections are the most recent 5-year averages. Retrospective adjusted SSB and age 5 to 7 average F in 2021 fell inside the 90% confidence intervals of the unadjusted 2021 value under the base model (Figures 47–48). Retrospective adjusted SSB and age 5 to 7 average F in 2021 fell inside the 90% confidence intervals of the unadjusted 2021 values under the flat sel sensitivity model (Figures 47–48). Therefore, no retrospective adjustments were made to the initial numbers-at-age in the projections for the base and flat sel sensitivity models.
| Year | Catch (mt) | SSB (mt) | FAVG | Catch (mt) | SSB (mt) | FAVG |
|---|---|---|---|---|---|---|
| base | flat sel sensitivity | |||||
| 2022 | 3,959 | 221,460 | 0.042 | 3,959 | 106,896 | 0.072 |
| Year | Catch (mt) | SSB (mt) | FAVG | Catch (mt) | SSB (mt) | FAVG |
| base | flat sel sensitivity | |||||
| 2023 | 19,617 | 213,579 | 0.235 | 11,760 | 105,307 | 0.237 |
| 2024 | 17,546 | 189,776 | 0.235 | 10,769 | 94,974 | 0.237 |
| 2025 | 16,245 | 170,132 | 0.235 | 10,168 | 86,279 | 0.237 |
Special Comments:
- •
What are the most important sources of uncertainty in this stock assessment? Explain, and describe qualitatively how they affect the assessment results (such as estimates of biomass, F, recruitment, and population projections).
One of the greatest sources of uncertainty in the pollock assessment is selectivity, as the base model with dome-shaped survey and fishery selectivity curves implies the existence of a large cryptic biomass that neither current surveys nor the fishery can confirm. Assuming that survey selectivity is flat-topped leads to lower estimates of SSB and higher estimates of F. Stock status is insensitive to the shape of the survey selectivity patterns at older ages. Short term projection results differ based on the shape of the survey selectivity patterns at older ages. After the assessment, a consequence analysis is normally conducted to evaluate the management implications of the survey selectivity assumptions.
- •
Does this assessment model have a retrospective pattern? If so, is the pattern minor, or major? (A major retrospective pattern occurs when the adjusted SSB or FAVG lies outside of the approximate joint confidence region for SSB and FAVG).
The 7-year Mohn’s ρ, relative to SSB, was 0.301 under the base model and 0.579 under theflat sel sensitivity model in the 2019 assessment and was 0.163 and 0.376, respectively, in 2021. The 7-year Mohn’s ρ, relative now to F, was −0.282 under the base model and −0.389 under the flat sel sensitivity model in the 2019 assessment and was −0.154 and −0.263, respectively, in 2021. There was a minor retrospective pattern for the base model because the ρ-adjusted estimates of 2021 SSB (SSBρ= 175,573 mt) and 2021 F (Fρ= 0.052) were inside the approximate 90% confidence region around SSB (74,991–276,155 mt) and F (0.026–0.077). There was a minor retrospective pattern for the flat sel sensitivity model because the ρ-adjusted estimates of 2021 SSB (SSBρ= 85,109 mt) and 2021 F (Fρ= 0.092) were inside the approximate 90% confidence region around SSB (46,729–123,490 mt) and F (0.047–0.137). No retrospective adjustment was made for the determination of stock status and for projections of catch in 2023 for both the base and flat sel sensitivity models.
- •
Based on this stock assessment, are population projections well determined or uncertain? If this stock is in a rebuilding plan, how do the projections compare to the rebuilding schedule?
Population projections for pollock appear to be reasonably well determined for both the base and flat sel sensitivity models. The stock is not in a rebuilding plan.
- •
Describe any changes that were made to the current stock assessment, beyond incorporating additional years of data and the affect these changes had on the assessment and stock status.
Three changes were explored in the current pollock assessment. First, tow-specific swept-area spring and fall bottom trawl survey indices were include in the assessment models. The tow-specific swept-area survey indices were similar to the traditional survey indices. The change in survey indices does not appear to have affected the assessment results. Second, based on a recommendation from the 2019 peer review panel, the separate commercial and recreational fleets were combined into a single fleet to reduce over-parameterization and improve model convergence. Combining the fishing fleets did improve model convergence and stability, while producing similar SSB and F estimates as the two-fleet model. Third, based on a recommendation from the 2019peer review panel, the first year of the assessment was changed from 1970 to 1981, the first year of recreational catch data. The peer review panel was concerned that the sudden introduction of the new calibrated MRIP recreational catch estimates in 1981 might cause problems for the models. When the 1981 start year was applied to the one-fleet model, model stability and diagnostics were similar to the 1970-start-year model, but the stock was estimated to be less productive. The one-fleet 1970-start-year model was put forward as the base model, because dropping the first 11 years of data did not lead to a significant improvement in model diagnostics.
- •
If the stock status has changed a lot since the previous assessment, explain why this occurred.
Stock status based on the base and flat sel sensitivity models has not changed since the previous assessment.
- •
Provide qualitative statements describing the condition of the stock that relate to stock status.
Total removals of pollock have declined since 2013. The spring survey index increased from 2013 to 2018, decreased in 2019, and has remained relatively constant since that time. The fall survey index decreased from 2014 to 2017, and has remained relatively constant since that time. Fishery and survey data suggest the existence of a relatively strong 2013 year class, which has recruited to the commercial fishery. Survey data suggests that older fish have begun to reappear in the stock since the late-1990s.
- •
Indicate what data or studies are currently lacking and which would be needed most to improve this stock assessment in the future.
The pollock assessment could be improved with additional studies on gear selectivity. These studies could cover topics such as physical selectivity (e.g., multi-mesh gillnet), behavior (e.g., swimming endurance, escape behavior), geographic and vertical distribution by size and age, tag-recovery at size and age, and evaluating information on length-specific selectivity at older ages. A satellite tagging project has been funded, which may provide information on the vertical distribution of pollock in the water column.
- •
Are there other important issues?
The assessment plan for pollock that was presented at the AOP meeting included the development and evaluation of a historic recreational catch time series, 1970–1980. Construction of the historic catch series was not completed, due to time constraints. The historic recreational catch scenario could be explored in a future assessment.
13.1. Reviewer Comments: Pollock
The 2022 assessment of the pollock (Pollachius virens) stock updates the 2019 ASAP assessment (NEFSC 2022)2424 NEFSC. 2022. Operational Assessment of 14 Northeast Groundfish Stocks Updated Through 2018. US Dept Commer, NOAA Fisheries, Northeast Fish Sci Cent Ref Doc. 22-06; 227p.CRD22-06 with additional commercial and recreational fishery catch data, research survey indices of abundance, and biological reference points through 2021. Stock projections have been updated through 2025.
The Panel concluded that the 2022 assessment update for pollock fulfilled the recommendations of the AOP, is technically sufficient to evaluate stock status and provide scientific advice and meets the Terms of Reference for the stock’s assessment. The assessment represents Best Scientific Information Available (BSIA) for this stock for management purposes.
Terms of Reference: Pollock
- 1.
Estimate catch from all sources including landings and discards.
- 2.
Evaluate indices used in the assessment (e.g., indices of relative or absolute abundance, recruitment, state surveys, age-length data, etc.).
This TOR was satisfactorily addressed.
Spring and fall tow-specific swept area bottom NEFSC trawl survey indices as well as survey maturities, and weights at age were updated through 2021 (2020 surveys were not conducted).
Panel recommended continued research into survey selectivity including the satellite tagging project and pollock swimming speed studies that could help support or refute the dome shaped selectivity. Consideration should also be given to splitting the Albatross IV and Bigelow survey indices.
- 3.
Estimate annual fishing mortality, recruitment and stock biomass (both total and spawning stock) as possible (depending on the assessment method) for the time series using the approved assessment method and estimate their uncertainty. Include retrospective analyses if possible (both historical and within-model) to allow a comparison with previous assessment results and projections, and to examine model fit.
- (a)
Include bridge runs to sequentially document each change from the previously accepted model to the updated model proposed for this peer review.
- (b)
Prepare a backup assessment approach that would serve as an alternative for providing scientific advice to management if the analytical assessment were to not pass review.
This TOR was satisfactorily addressed.
The most recent benchmark assessment of the pollock stock was in 2010 as part of the 50th Stock Assessment Review Committee (NEFSC 2010)2525 NEFSC. 2010. 50th Northeast Regional Stock Assessment Workshop (SAW 50) Assessment Report. US Dept Commer, Northeast Fish Sci Cent Ref Doc. 10-17; 844p.CRD10-17, which includes a full description of the ASAP model formulations. Two population assessment models were brought forward from the 2019 Operational Assessment: the base model (dome-shaped survey selectivity), which is used to provide management advice; and the flat-topped survey selectivity model (flat sel), which is included for the sole purpose of demonstrating the sensitivity of assessment results to survey selectivity assumptions. A bridge run comparing the 2019 and 2022 base models (2-Fleet Start year 1970) with the latter updated to the 2021 terminal year was run and showed that the 2013 year class was smaller than estimated in the 2019 assessment (and reduced terminal year SSB with little effect on F).
The analyst further considered four permutations of these models: 1-Fleet versus 2-Fleet and Start Year 1970 versus 1981. The 1-Fleet 1970-Start-Year model was selected as the 2022 base model, because the 1-Fleet model improved model convergence, and there was no significant improvement in model fit or performance to justify dropping the first 11 years of data from the assessment. A base model was obtained by fine-tuning the 1-Fleet 1970-Start-Year model to improve RMSE for each set of residuals.
The base model assumes dome-shaped fishery and survey selectivities, and this results in a cryptic biomass of older fish that cannot be confirmed by the fishery or surveys. A sensitivity model with flat-top survey selectivities was carried forward through reference point calculations and short-term projections to evaluate model sensitivity to selectivity assumptions (Flat-top selectivity = selectivity for ages 6+ fixed at 1.0). Note that the flat sel sensitivity model is only to be used as a sensitivity analysis and is not to be used for catch advice.
The Panel recommended that the one fleet model beginning in 1970 with dome shaped selectivity was the better model. It has the lowest AIC and retrospective pattern; the 1970 start date provides more historic data; and the model tuning further improved the retrospective pattern.
Concern was, however, expressed about selecting selectivity time-blocks based on visual inspection of residuals. Without some external forcing mechanism (e.g., a management measure or fishery shift) this introduces significant uncertainty into the selectivity function.
Also, the tuning process which relaxed the CV on the surveys and catch while tightening the CV on discards seemed counterintuitive, given discards are generally less well known than the catch or survey data.
The model results of SSB are very sensitive to the starting year (1970∼1981) and to the selectivity assumptions (domed∼flat), which indicate the scale of the model estimated stock size can be problematic. The % of fish of age 9+ in the CAA and survey age compositions are high based on the bubble plots. The estimated SSBs of age 9+ are higher than 40–60% of the stock’s total SSB over the years even when flat selectivity was used. Future stock assessment may consider increasing the age of the plus group to see whether it can solve the scaling difficulty.
- (a)
- 4.
Re-estimate or update the BRPs as defined by the management track level and recommend stock status. Also, provide qualitative descriptions of stock status based on simple indicators/metrics (e.g., age- and size-structure, temporal trends in population size or recruitment indices, etc.).
This TOR was satisfactorily addressed.
No retrospective adjustments were made to the model results. Spawning stock biomass (SSB) in 2021 was estimated to be 175,573 mt under the base model and 85,109 mt under the flat sel sensitivity model which is 191 and 150% (respectively) of the biomass target, an SSBMSY proxy of SSB at F40%SPR (92,130 and 56,817 mt). The 2021 age 5 to 7 average fishing mortality (F) was estimated to be 0.052 under the base model and 0.092 under the flat sel sensitivity model, which is 22% and 39% (respectively) of the overfishing threshold, an FMSY proxy of F40%SPR (0.235 and 0.237).
The stock is not overfished and overfishing is not occurring.
- 5.
Conduct short-term stock projections when appropriate.
This TOR was satisfactorily addressed.
Short term projections of median total fishery yield and spawning stock biomass for pollock were conducted using agepro and based on a harvest scenario of fishing at an FMSY proxy of F40%SPR between 2023 and 2025. Recruitments were sampled from a cumulative distribution function derived from ASAP estimated age-1 recruitment between 1970 and 2019. Recruitments in 2020 and 2021 were not included due to uncertainty in those estimates. The annual fishery selectivity, natural mortality, maturity ogive, and mean weights used in projections are the most recent 5-year averages. No retrospective adjustments were made.
The estimated catch for 2022 is 3959 mt, which results in catch advice of 19614, 17546, and 16249 mt for 2023–2025, respectively.
- 6.
Respond to any review panel comments or SSC concerns from the most recent prior research or management track assessment.
This TOR was satisfactorily addressed.
The analyst has successfully responded to four significant sets of recommendations from the 2019 review.
This Panel recommended research into:
- •
Survey selectivity including the satellite tagging and pollock swimming speed studies that could help support or refute the dome shaped selectivity
- •
- •
Increase the age of the plus age group.
- •
References:
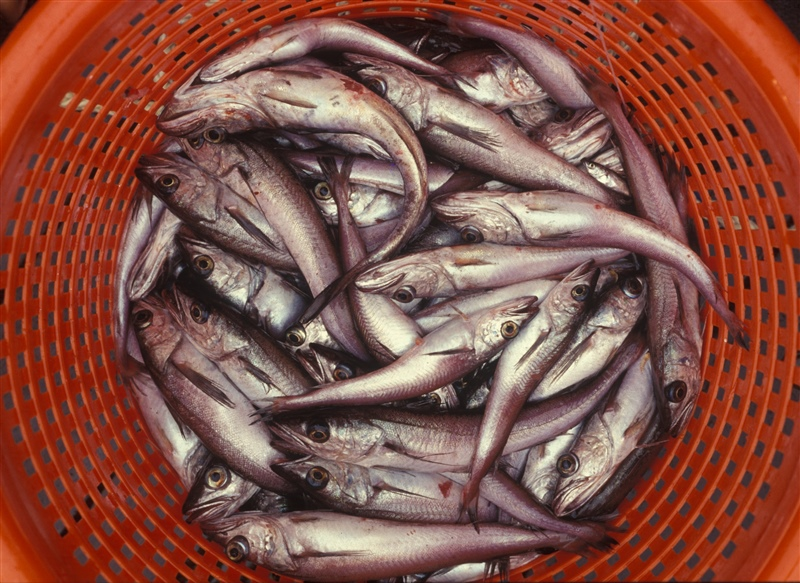
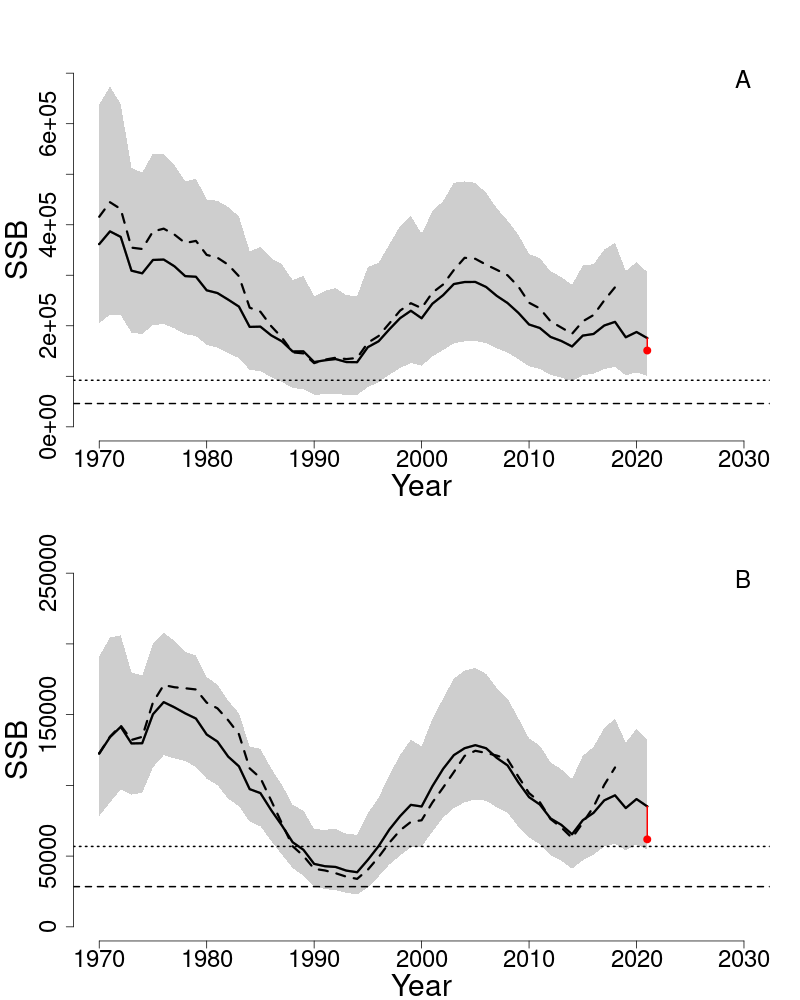
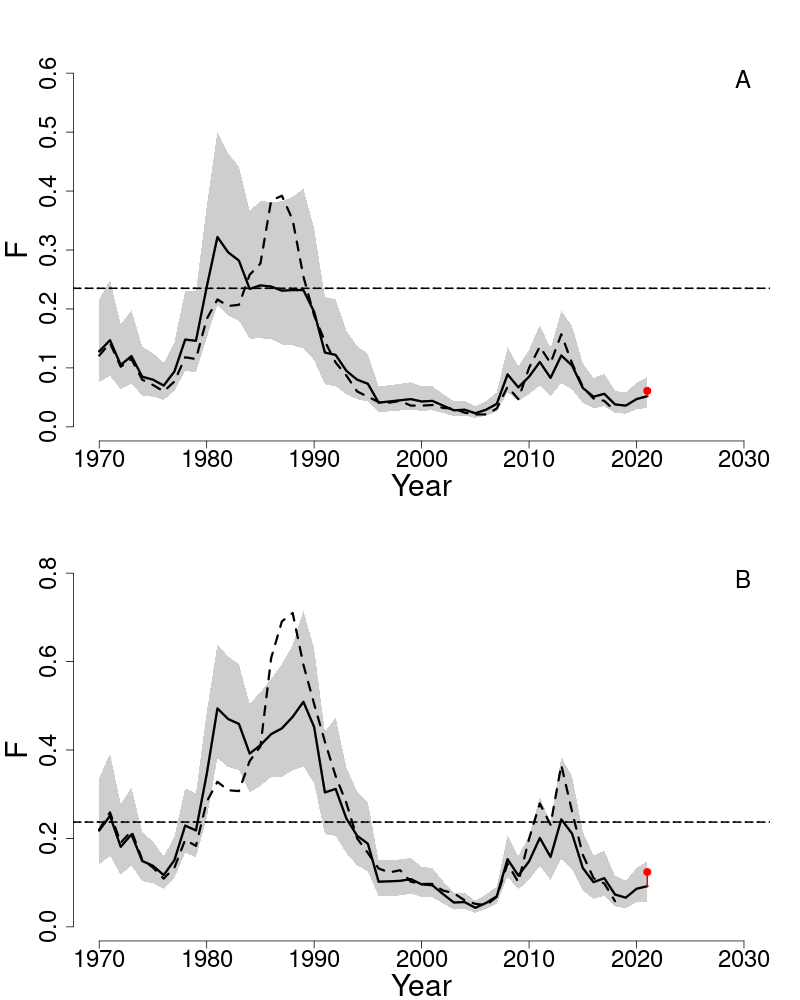
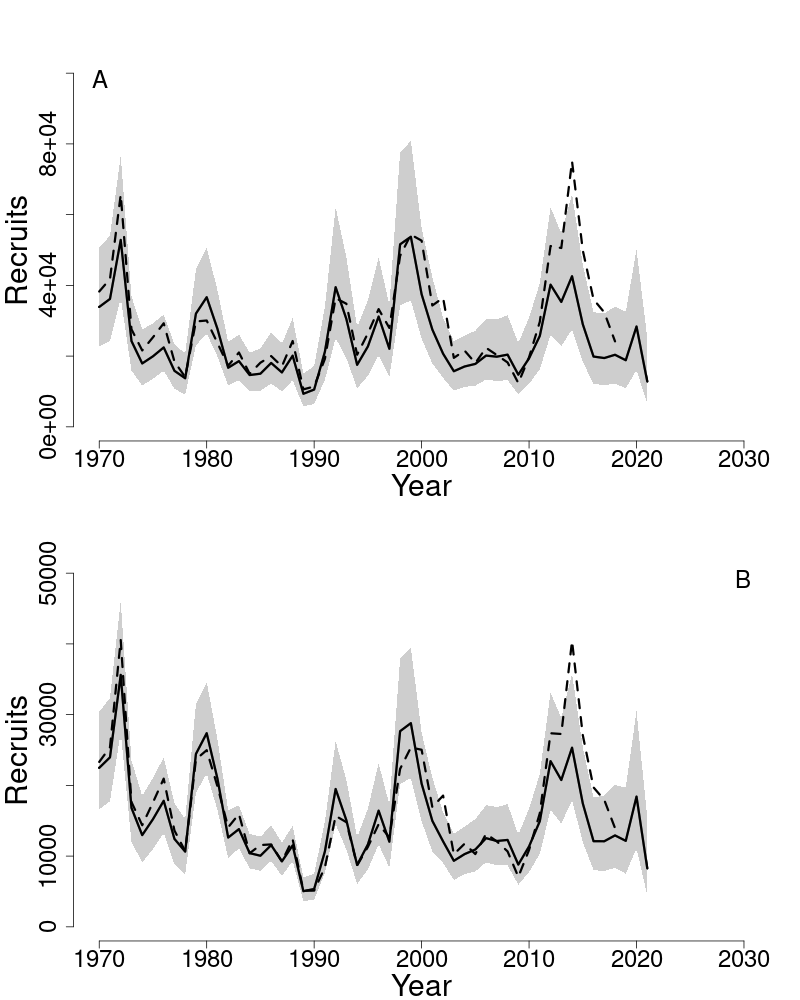
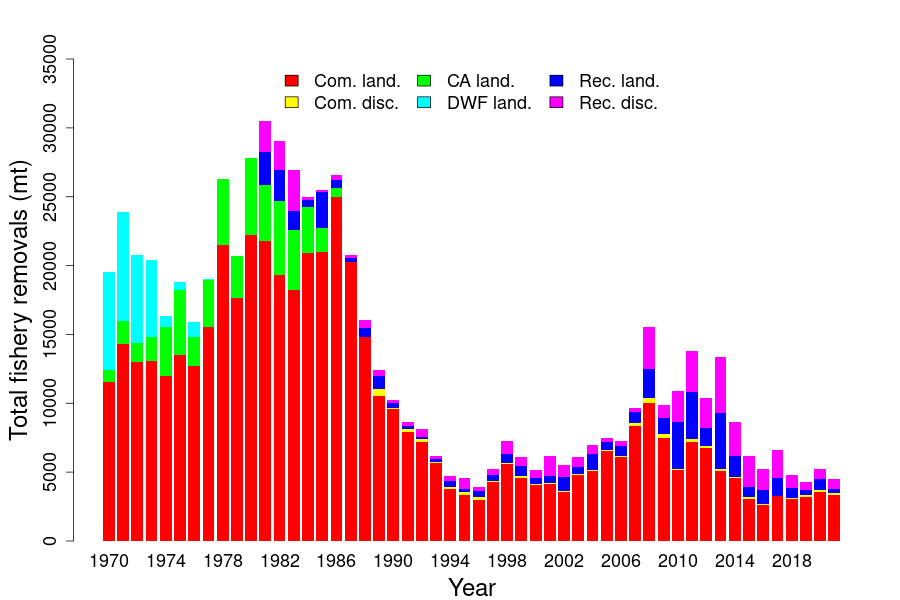
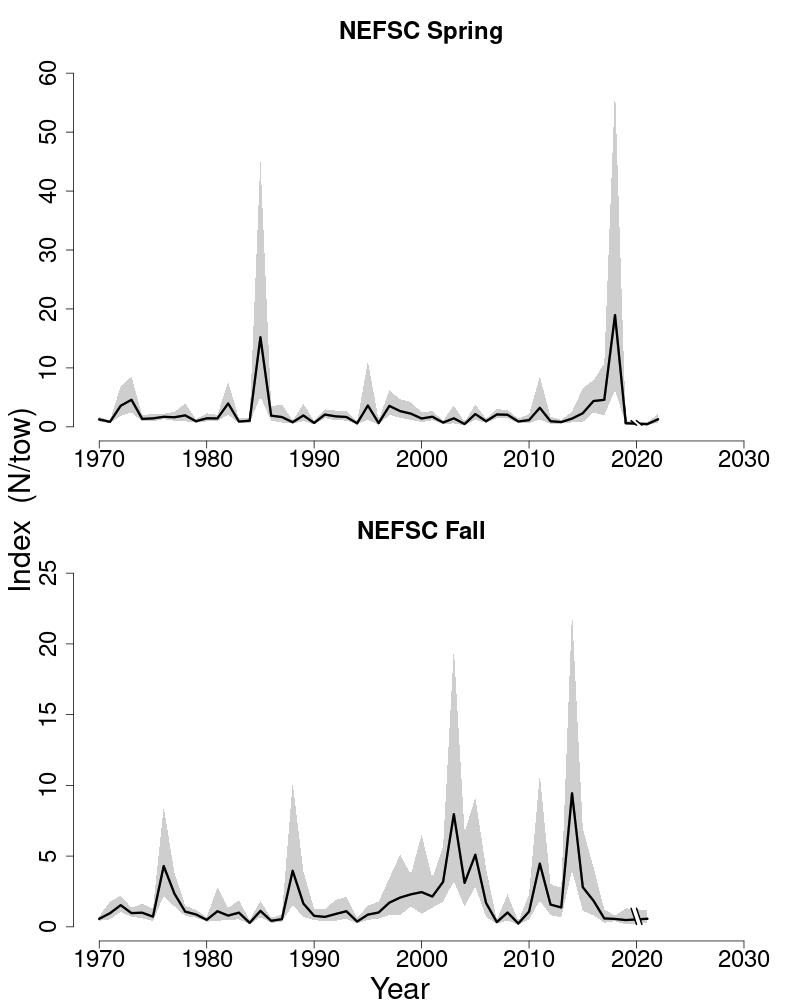
14. WITCH FLOUNDER
This assessment of the witch flounder (Glyptocephalus cynoglossus) stock is a management track assessment of the existing 2019 assessment (NEFSC 2022). Based on the 2019 assessment the stock status was overfished and overfishing unknown, and stock condition was poor. This assessment updates commercial fishery catch data through 2021 (Table 33, Figure 54), and updates research survey biomass indices and the empirical approach assessment through 2021 (Figure 55). No stock projections can be computed using the empirical approach.
State of Stock: Based on this updated assessment, witch flounder (Glyptocephalus cynoglossus) recommended stock status cannot be determined analytically due to a lack of biological reference points associated with the empirical approach; stock condition remains poor. Retrospective adjustments were not made to the model results. The exploitable biomass in 2021 (defined as the arithmetic average of the 2021 NEFSC spring and 2020 NEFSC fall surveys population biomass estimates and converted to exploitable biomass (multiplied by 0.9) based on examination of survey and fishery selectivity patterns) was estimated to be 22,419 (mt) (Figure 52). The 2021 exploitation rate (2021 catch divided by 2021 exploitable biomass) was estimated to be 0.039 (Figure 53).
| 2011 | 2012 | 2013 | 2014 | 2015 | 2016 | 2017 | 2018 | 2019 | 2020 | 2021 | |
|---|---|---|---|---|---|---|---|---|---|---|---|
| Data | |||||||||||
| Commercial Landings | 870 | 1,038 | 686 | 570 | 492 | 397 | 446 | 606 | 800 | 869 | 823 |
| Commercial Discards | 201 | 231 | 124 | 107 | 94 | 115 | 106 | 115 | 95 | 90 | 56 |
| Catch for Assessment | 1,072 | 1,270 | 811 | 676 | 586 | 512 | 552 | 722 | 894 | 959 | 879 |
| Model Results | |||||||||||
| Exploitable Biomass | 16,313 | 18,404 | 12,533 | 14,628 | 17,289 | 15,847 | 22,247 | 32,546 | 25,736 | 27,958 | 22,419 |
| Exploitation Rate | 0.066 | 0.069 | 0.065 | 0.046 | 0.034 | 0.032 | 0.025 | 0.022 | 0.035 | 0.034 | 0.039 |
| 2019 | 2022 | |
|---|---|---|
| FMSY proxy | NA | NA |
| SSBMSY (mt) | NA | NA |
| MSY (mt) | NA | NA |
| Overfishing | Unknown | Unknown |
| Overfished | Yes | Yes |
Projections: Short term projections cannot be computed using the empirical approach. The estimated 2022 exploitable biomass is 19,393 mt. Using the January 2017 NEFMC PDT SSC approach for catch advice, application of the mean exploitation rate of 5.4% (based on nine years, 2007–2015) to the 3 year (2020–2022) moving average of exploitable biomass (23,257mt) results in an estimated catch for 2023 of 1,256 mt.
Special Comments:
- •
What are the most important sources of uncertainty in this stock assessment? Explain, and describe qualitatively how they affect the assessment results (such as estimates of biomass, F, recruitment, and population projections).
Uncertainty in the catch has increased due to criminal convictions in a case involving catch misreporting.
- •
Does this assessment model have a retrospective pattern? If so, is the pattern minor, or major? (A major retrospective pattern occurs when the adjusted SSB or FFull lies outside of the approximate joint confidence region for SSB and FFull).
The model used to estimate status of this stock does not allow estimation of a retrospective pattern.
- •
Based on this stock assessment, are population projections well determined or uncertain? If this stock is in a rebuilding plan, how do the projections compare to the rebuilding schedule?
Population projections for witch flounder are not computed. Catch advice is derived from applying a mean exploitation rate of 0.054 (based on nine years, 2007–2015) to the 3-year average (2020–2022) of the exploitable biomass. The change in mean exploitation rate from 0.049 (2019 assessment) to 0.054 emanated from the use of tow-specific swept area indices. The stock is in a revised rebuilding plan, rebuilding by 2043. Since 2019, the average survey biomass has declined despite catches being below the catch advice from the 2019 assessment.
- •
Describe any changes that were made to the current stock assessment, beyond incorporating additional years of data and the effect these changes had on the assessment and stock status.
Recent landings and discards were updated and the time series of survey indices were updated using tow-specific swept area; however, this has no impact on the stock status. In the 2022 assessment of witch flounder, the catch efficiency analyses were directly incorporated into the assessment model. Estimates of population biomass used revised seasonal catchability coefficients that varied by year; the revised seasonal catchability coefficients had a minor impact on catch advice for 2023. The 2018 NEFSC fall survey stratum 30 was not sampled; survey indices were not adjusted because this stratum represents less than 1% of total expanded catch weight and has negligible impact on survey indices and swept area biomass. The 2020 NEFSC spring and fall survey values are missing because of Covid. The missing survey values were not replaced with an average because the method used for catch advice is an average of the 3 most recent years of exploitable biomass, so filling the missing surveys was not deemed necessary. The 3 year (2020–2022) moving average exploitable biomass was derived using 2020 (Fall 2019 survey), 2021 (Spring 2021 survey), and 2022 (the average of Fall 2021 and Spring 2022).
- •
If the stock status has changed a lot since the previous assessment, explain why this occurred.
No change in stock status has occurred for witch flounder since the previous assessment. Biological references points remain unknown.
- •
Provide qualitative statements describing the condition of the stock that relate to stock status.
The witch flounder stock condition remains poor. Fishery landings and survey catch by age indicate continued truncation of age structure and a reduction in the number of older fish in the population. NEFSC relative indices of abundance and biomass remain below their time series average. The decline in exploitable biomass from 2020 to 2022 is notable.
- •
Indicate what data or studies are currently lacking and which would be needed most to improve this stock assessment in the future.
The witch flounder assessment could be improved with accurate catch statistics; catch statistics have been undermined by misreporting, as partially documented in the criminal case. Although not directly impacting the empirical approach assessment, the low commercial landings sampling in recent years impacts the ability to estimate numbers of fish landed at age and to track cohorts through time. It would be desirable to review the port and dockside monitoring sampling to better align sampling activities in accordance with market category landings and life history characteristics of witch flounder. Additional research recommendations are given in NEFSC 2017b.
- •
Are there other important issues?
The empirical approach does not incorporate age structure information. Consideration of incoming recruitment is critical for catch advice that supports stock rebuilding. Based on the surveys, there is no sign of a strong incoming year class.This assessment and the 2019 assessment used revised seasonal catchability coefficients (q vary by year) in the estimates of population biomass. The 2016 and 2017 assessments applied a constant catchability coefficient (0.291).Minimum estimates of scientific research removals of witch flounder ranged between 0.1 and 15.9mt, with an average of 1mt between 1963 and 2018. The NEFSC bottom trawl surveys, Massachusetts Division of Marine Fisheries inshore surveys, Atlantic States Marine Fisheries Commission summer shrimp surveys, and various Cooperative Research surveys (e.g., such as Industry-based surveys for cod and for yellowtail flounder) and gear studies have contributed to scientific research removals. The August 2016 Gear Efficiency Study removed 14.0mt of witch flounder. These removals would be included when an age-based assessment is conducted.
14.1. Reviewer Comments: Witch flounder
Witch flounder was not peer reviewed in fall of 2022.
References:
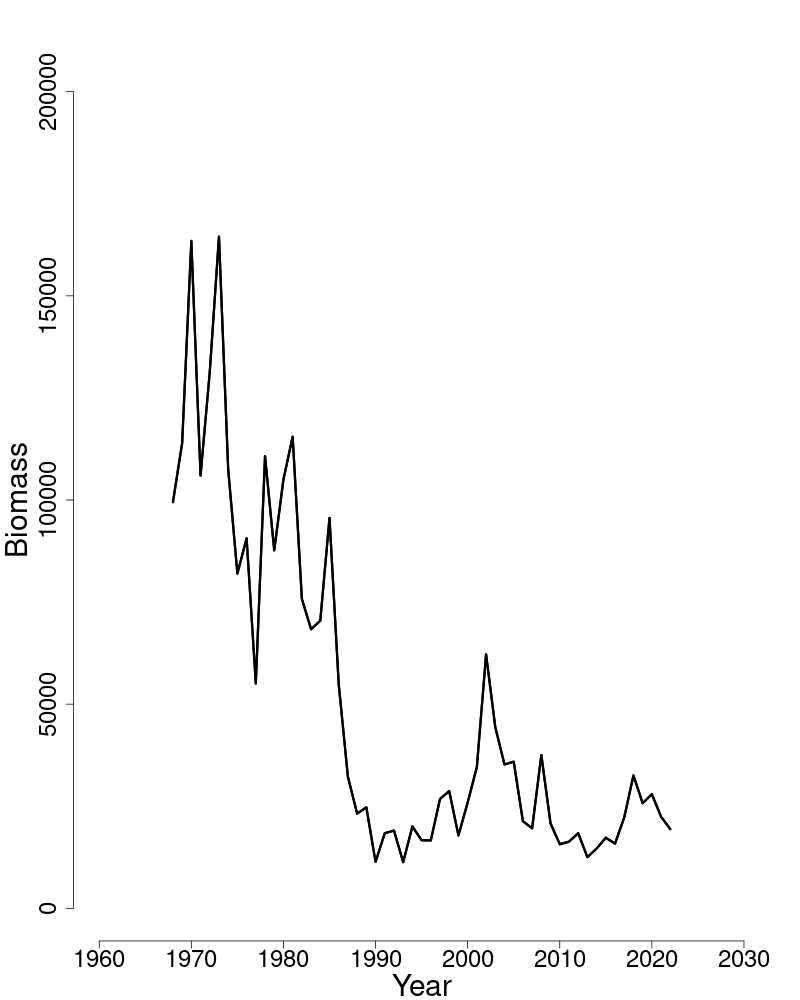
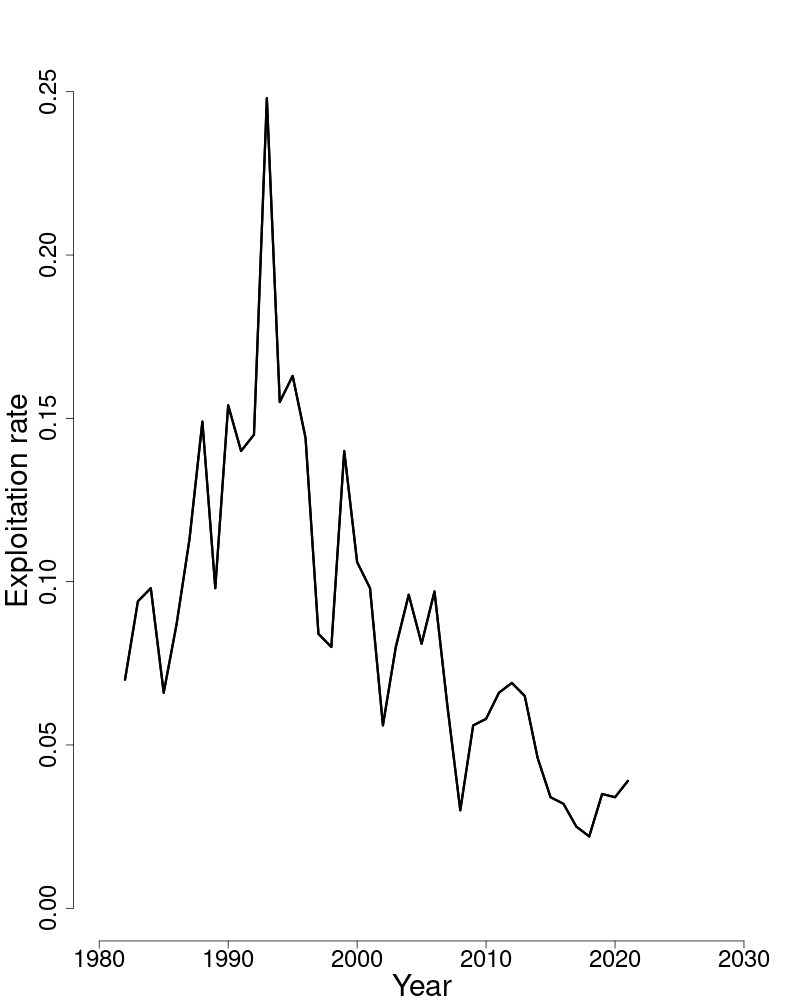
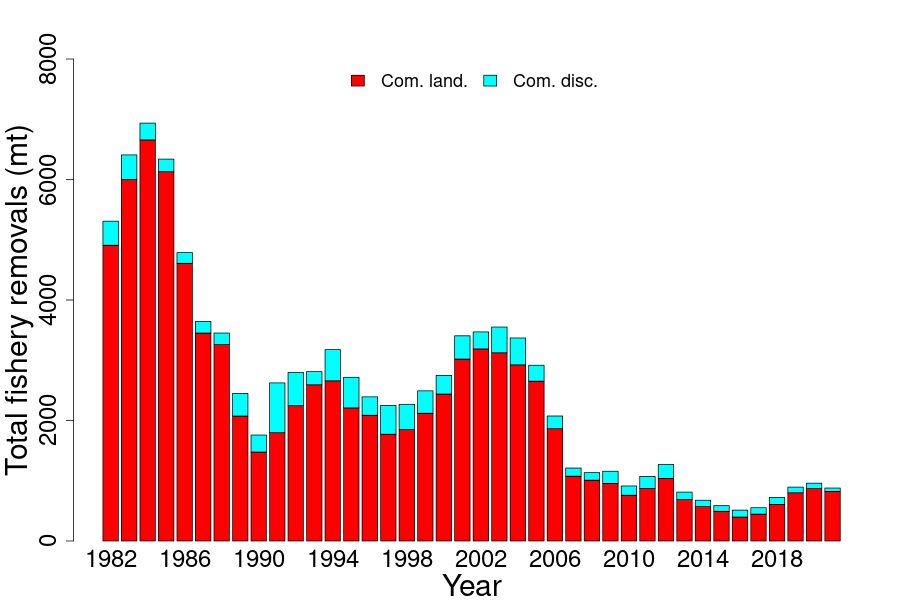
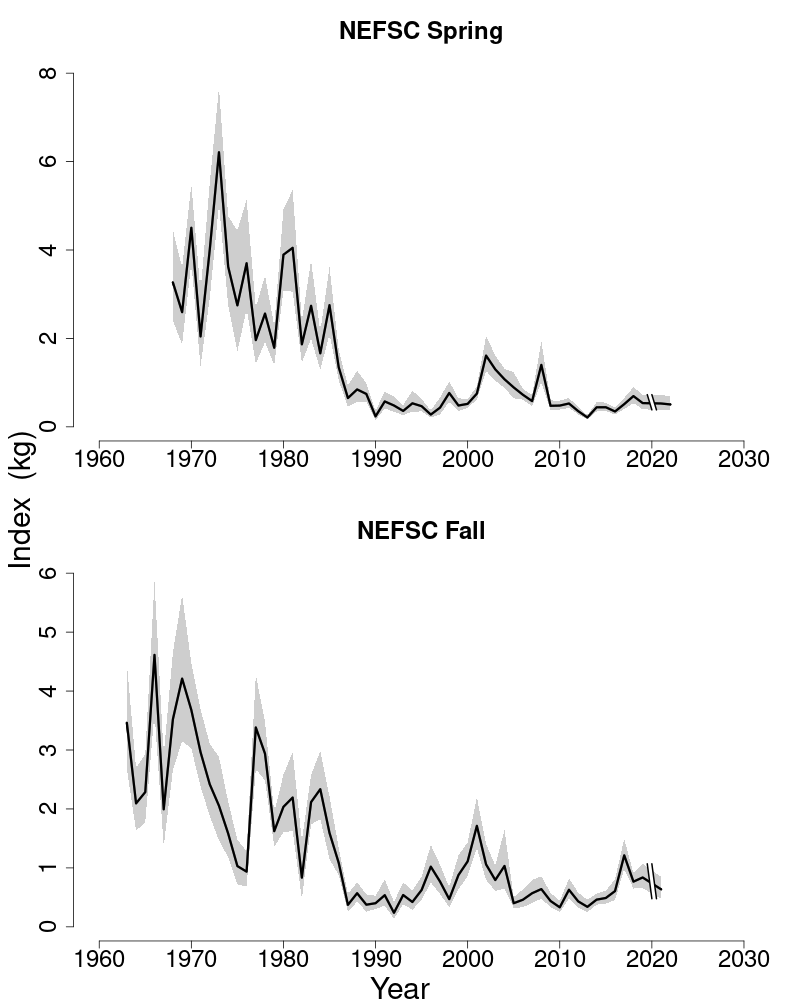
15. CAPE COD–GULF OF MAINE YELLOWTAIL FLOUNDER
This assessment of the Cape Cod–Gulf of Maine yellowtail flounder (Limanda ferruginea) stock is an operational assessment of the existing 2019 VPA assessment (Alade 2019). The last benchmark for this stock was in 2008 (Legault et al., 2008). Based on the previous assessment the stock was not overfished, and overfishing was not occurring. This 2022 assessment updates commercial fishery catch data, research survey indices of abundance, weights at age, and the analytical VPA assessment model and reference points through 2021. Additionally, stock projections have been updated through 2025.
State of Stock: Based on this updated assessment, Cape Cod–Gulf of Maine yellowtail flounder (Limanda ferruginea) stock is not overfished and overfishing is not occurring (Figures 56–57). Retrospective adjustments were made to the model results. Spawning stock biomass (SSB) in 2021 was estimated to be 3,058 (mt) which is 100% of the biomass target (SSBMSY proxy = 3,068; Figure 56). The 2021 fully selected fishing mortality was estimated to be 0.1035 which is 32% of the overfishing threshold proxy (FMSY proxy= 0.3204; Figure 57).
| 2012 | 2013 | 2014 | 2015 | 2016 | 2017 | 2018 | 2019 | 2020 | 2021 | |
|---|---|---|---|---|---|---|---|---|---|---|
| Data | ||||||||||
| Commercial discards | 146 | 86 | 54 | 45 | 66 | 50 | 45 | 44 | 35 | 71 |
| Commercial landings | 946 | 590 | 421 | 306 | 302 | 314 | 226 | 184 | 156 | 294 |
| Total Catch for Assessment | 1,092 | 676 | 475 | 351 | 368 | 365 | 271 | 228 | 192 | 365 |
| Model Results | ||||||||||
| Spawning Stock Biomass | 1,039 | 725 | 705 | 964 | 1,126 | 1,216 | 1,299 | 2,119 | 3,873 | 5,987 |
| FFull | 1.127 | 1.209 | 0.644 | 0.36 | 0.272 | 0.28 | 0.233 | 0.155 | 0.06 | 0.05 |
| Recruits (age-1) | 2,271 | 3,412 | 2,923 | 2,357 | 3,953 | 6,517 | 13,357 | 20,854 | 9,269 | 10,413 |
Projections: Short term projections of biomass were derived by sampling an empirical cumulative distribution function of 35 recruitment estimates from the VPA model results. The most recent two years (2021 and 2022) were not included in the series of recruitment values due to high uncertainty in these estimates. The annual fishery selectivity, maturity ogive, and mean weights at age used in projection are the most recent 5-year averages. Retrospective adjustments were applied in the projections.
| 2019 | 2022 | |
|---|---|---|
| FMSY proxy | 0.3204 | 0.3201 |
| SSBMSY (mt) | 3,439 | 3,068 (2,108–4,751) |
| MSY (mt) | 1,138 | 1,008 (696–1,554) |
| Median recruits (age-1) (000s) | 5,781 | 6,417 |
| Overfishing | No | No |
| Overfished | No | No |
| Year | Catch (mt) | SSB (mt) | FFull |
|---|---|---|---|
| 2022 | 350 | 4,334 (3,512–5,360) | 0.077 |
| Year | Catch (mt) | SSB (mt) | FFull |
| 2023 | 1,436 (1,129–1,784) | 4,433 (3,475–5,534) | 0.320 |
| 2024 | 1,197 (955–1,494) | 3,666 (2,929–4,542) | 0.320 |
| 2025 | 1,059 (828–1,434) | 3,269 (2,546–4,469) | 0.320 |
Special Comments:
- •
What are the most important sources of uncertainty in this stock assessment? Explain, and describe qualitatively how they affect the assessment results (such as estimates of biomass, F, recruitment, and population projections).
Retrospective patterns remain a source of uncertainty in the assessment. This has persisted for a number of years causing a decrease in estimates of spawning stock biomass (SSB) and and an increase in fishing mortality (F) when more years of data are added. The magnitude of these retrospective biases in this assessment have notably increased for both F and SSB compared to the previous 2019 Management Track assessment. With the exception of the 2020 ME/NH fall survey index, another potential source of uncertainty is the missing 2020 fall (NEFSC, MA DMF) and spring (NEFSC, MA DMF and ME/NH) survey data indices in the model.In this assessment, the 2020 survey indices were assigned as missing in the VPA model due to unavailable surveys data in 2020 as a result of Covid. The treatment of missing data in the VPA model was not based on any form of imputations but rather the model was allowed to generate a survey prediction based on neighboring observed values. However, the model fit to the missing 2020 survey indices does not contribute to the overall objection function in the model.The VPA model assumes catch is known without error, which is the case for this assessment and certainly not a valid assumption. The VPA model framework provides very little opportunity to leverage data uncertainty into estimates of population quantities produced by the model.
- •
Does this assessment model have a retrospective pattern? If so, is the pattern minor, or major? (A major retrospective pattern occurs when the adjusted SSB or FFull lies outside of the approximate joint confidence region for SSB and FFull).
The 7-year Mohn’s ρ, relative to SSB, was 0.30 in the 2019 assessment and was 0.96 in 2021. The 7-year Mohn’s ρ, relative to F, was −0.15 in the 2019 assessment and was −0.52 in 2021. There was a major retrospective pattern for this assessment because the ρ-adjusted estimates of 2021 SSB (SSBρ= 3058) and 2021 F (Fρ= 0.1035) were outside the approximate 90% confidence region around SSB (4,976–7,428) and F (0.04–0.06). A retrospective adjustment was made for both the determination of stock status and for projections of catch in 2023. The retrospective adjustment changed the 2021 SSB from 5,987 to 3,058 and the 2021 FFull from 0.05 to 0.1035.
- •
Based on this stock assessment, are population projections well determined or uncertain?
Population projections for Cape Cod-Gulf of Maine yellowtail flounder are uncertain for reasons associated with the retrospective bias in this updated assessment. The 2021 estimates of SSB from this assessment is not within the bound of values projected in the 2019 Management Track assessment. The 2019 estimate of SSB from the current assessment is below the the 2019 ρ-adjusted SSB from the 2019 Management Track assessment, indicating the ρ-adjustment applied in 2019 assessment was not large enough.
- •
Describe any changes that were made to the current stock assessment (e.g., catch efficiency studies), beyond incorporating additional years of data and the effect these changes had on the assessment and stock status.
Minor changes in addition to the incorporation of new data were made to the Cape Cod–Gulf of Maine yellowtail flounder assessment for this update. The NEFSC spring and fall indices were revised from 2009 to 2022 to account for tow-specific area swept. The data source for commercial landings changed to the Catch Accounting and Monitoring System (CAMS) beginning in 2020 and were used to produce commercial landings estimates for 2020 and 2021.In the previous 2019 Management track assessment (NEFSC, 2022), The 2019 spring MA DMF survey age composition was derived by borrowing from the 2019 spring NEFSC ALK due to unavailable 2019 spring MA DMF ages at the time of the assessment. In this assessment, the 2019 spring survey age composition was revised to use the MA DMF Age-length keys (ALK), consistent with the previous assessment and the benchmark formulation in 2008 (GARM III). A sensitivity run was conducted to evaluate the impact of this change. The revision to the 2019 spring MA DMF survey age composition resulted in little to no effect on the assessment results.The incorporation of new data (2019–2021) to the model resulted in rescaling of SSB and F which partially explains the cause of retrospective pattern in the model.
- •
If the stock status has changed a lot since the previous assessment, explain why this occurred.
The stock status for Cape Cod–Gulf of Maine yellowtail flounder is now rebuilt due increases in the survey biomass. Based on this assessment, estimated SSB in 2021 is above both the SSBThreshold and SSBTarget. The stock is in a rebuilding plan with a rebuild date of 2023. Based on the the 2022 assessment, the stock is rebuilt and continues to be in the 3-year projections.
- •
Provide qualitative statements describing the condition of the stock that relate to stock status.
All indices has shown increases in recent years. CCGM yellowtail stock show no truncation in the age structure. There has been some moderate expansion in the older age groups which is also supported by the surveys. There is an above average estimated 2018 and 2020 incoming year classes which has contributed to the increase in total biomass. Estimates of commercial catch continue are still levels compared to historical catches and consistent with increase in stock biomass.
- •
Indicate what data or studies are currently lacking and which would be needed most to improve this stock assessment in the future.
The Cape Cod–Gulf of Maine yellowtail flounder assessment could be improved with a change in model platform that incorporates statistical fits and accounts for measures of uncertainty in the model. Additionally, this assessment could benefit from updated growth and maturity studies. The current maturity and growth parameters are based on GARM III estimates (NEFSC 2008) which are over a decade old. It should be noted that the Cape Cod-Gulf of Maine yellowtail assessment is currently undergoing a Research Track assessment, scheduled for 2024.
- •
Are there other important issues?
None.
15.1. Reviewer Comments: Cape Cod–Gulf of Maine yellowtail flounder
Cape Cod–Gulf of Maine yellowtail flounder was not peer reviewed in fall of 2022.
References:
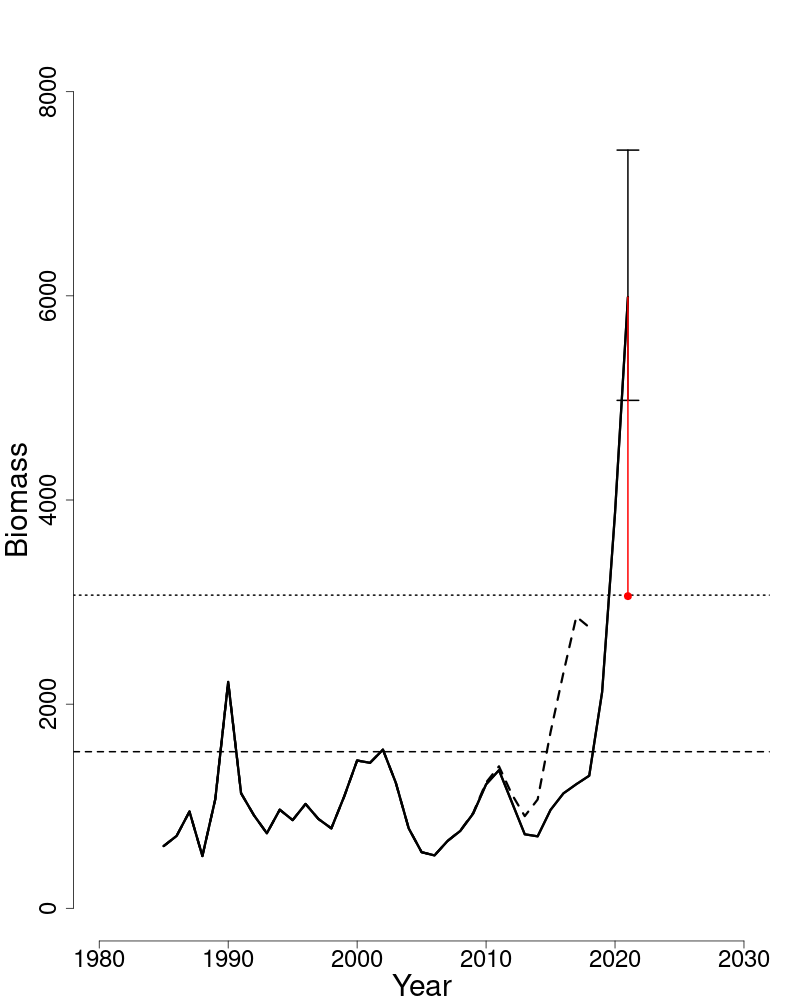
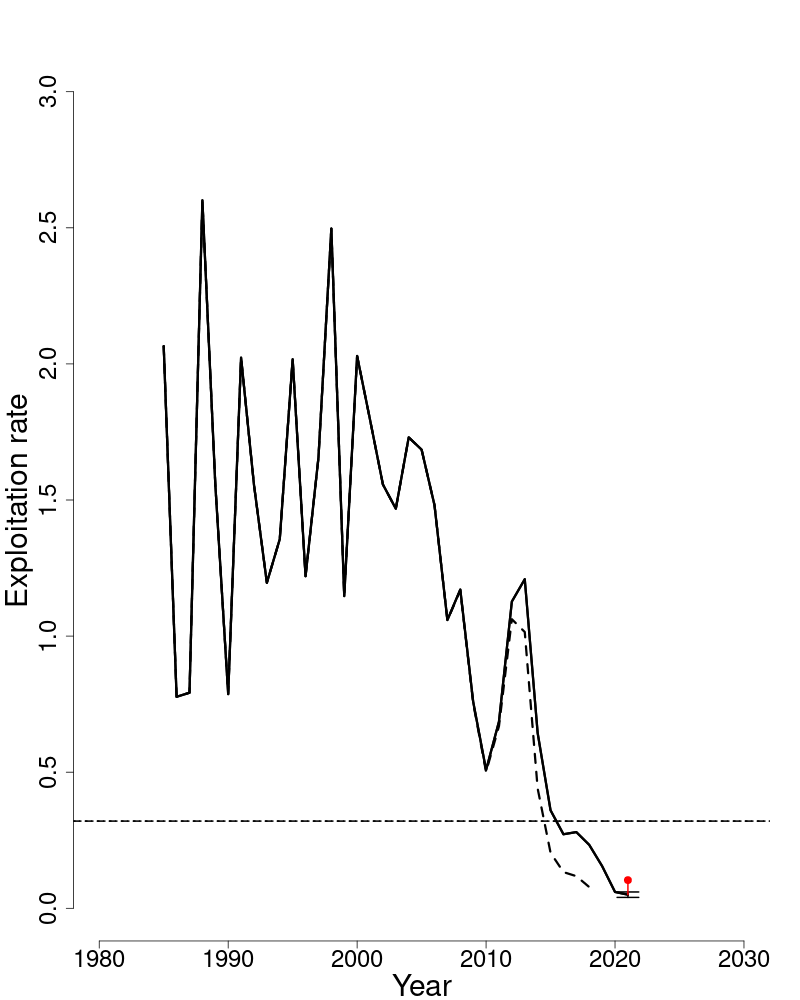
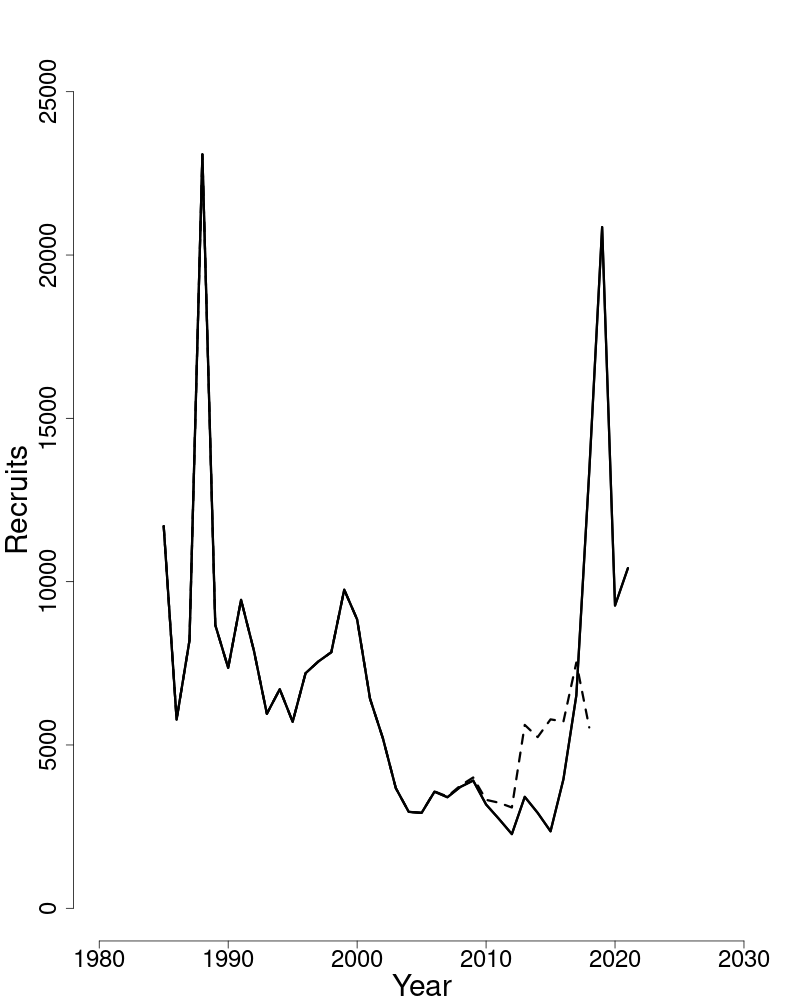
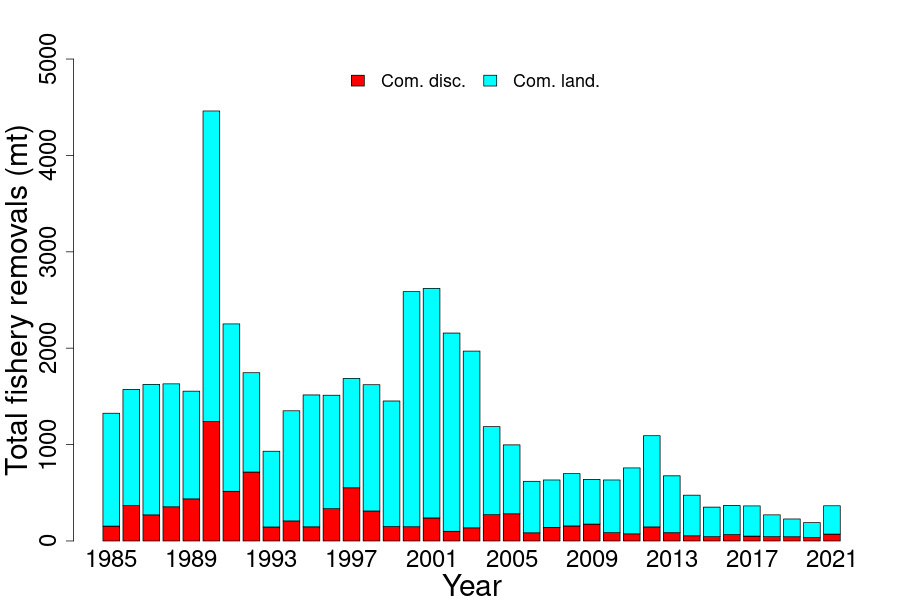
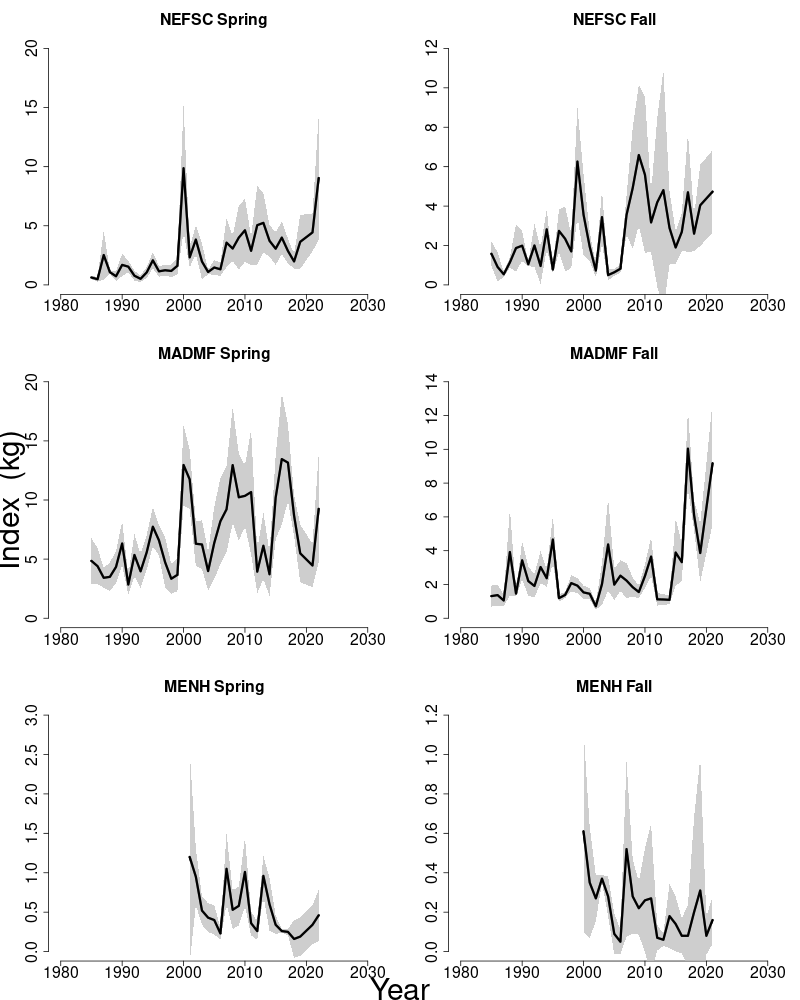
16. SOUTHERN NEW ENGLAND/MID-ATLANTIC YELLOWTAIL FLOUNDER
This assessment of the Southern New England/Mid-Atlantic yellowtail flounder (Limanda ferruginea) stock is a Level 2 Management Track assessment of the existing 2012 benchmark assessment (NEFSC 2012). Based on the previous assessment (NEFSC 2022), the stock was overfished, but overfishing was not occurring. This assessment updates commercial fishery catch data, research survey indices of abundance, and the analytical ASAP assessment model and reference points through 2021. Additionally, stock projections have been updated through 2025.
State of Stock: Based on this updated assessment, the Southern New England/Mid-Atlantic yellowtail flounder (Limanda ferruginea) stock is overfished and overfishing is not occurring (Figures 61–62). Retrospective adjustments were made to the model results. Spawning stock biomass (SSB) in 2021 was estimated to be 70 mt which is 4% of the biomass target (SSBMSY proxy= 1,715; Figure 61). The 2021 fully selected fishing mortality was estimated to be 0.082 which is 23% of the overfishing threshold proxy (FMSY proxy= 0.349; Figure 62).
| 2012 | 2013 | 2014 | 2015 | 2016 | 2017 | 2018 | 2019 | 2020 | 2021 | |
|---|---|---|---|---|---|---|---|---|---|---|
| Data | ||||||||||
| Commercial discards | 221 | 185 | 109 | 53 | 26 | 16 | 8 | 6 | 5 | 4 |
| Commercial landings | 342 | 461 | 516 | 284 | 126 | 48 | 11 | 2 | 2 | 1 |
| Catch for Assessment | 563 | 646 | 625 | 337 | 152 | 64 | 19 | 8 | 7 | 5 |
| Model Results | ||||||||||
| Spawning Stock Biomass | 1,610 | 1,318 | 865 | 422 | 159 | 59 | 36 | 45 | 142 | 241 |
| FFull | 0.585 | 0.745 | 0.906 | 0.961 | 1.076 | 1.272 | 0.788 | 0.291 | 0.1 | 0.032 |
| Recruitment (age-1) | 1,671 | 1,104 | 179 | 88 | 66 | 179 | 226 | 1,155 | 449 | 4,396 |
Projections: Short term projections of biomass were derived by sampling from an empirical cumulative distribution function of 30 recruitment estimates from the ASAP model results. Following the previous and accepted benchmark formulation, recruitment was based on recent estimates of recruitments from the model time series (i.e., corresponding to age-1 in years 1990 through 2019) to reflect the low recent pattern of recruitment in the stock. For projections, the annual fishery selectivity is from the most recent selectivity block in the model, the maturity ogive is the same as assumed for all years in the model,and mean weights-at-age are from 2014–2019 due to low or no sampling in 2020 and 2021; retrospective adjustments were applied in the projections.
| 2019 | 2022 | |
|---|---|---|
| FMSY proxy | 0.355 | 0.349 |
| SSBMSY (mt) | 1,756 | 1,715 (908–2,739) |
| MSY (mt) | 495 | 461 (245–739) |
| Median recruitment (age-1) (000s) | 6,562 | 6,004 |
| Overfishing | No | No |
| Overfished | Yes | Yes |
| Year | Catch (mt) | SSB (mt) | FFull |
|---|---|---|---|
| 2022 | 4 | 174 (102–293) | 0.033 (0.019–0.054) |
| Year | Catch (mt) | SSB (mt) | FFull |
| 2023 | 55 (33–91) | 203 (121–343) | 0.349 |
| 2024 | 84 (46–142) | 420 (157–930) | 0.349 |
| 2025 | 152 (58–319) | 815 (261–1,641) | 0.349 |
Special Comments:
- •
What are the most important sources of uncertainty in this stock assessment? Explain, and describe qualitatively how they affect the assessment results (such as estimates of biomass, F, recruitment, and population projections).
The long-term outlook for this stock. Recent papers (Stock and Miller 2021, du Pontavice et al. 2022) found a relationship between the Cold Pool Index, a measure of cold water in the Mid-Atlantic Bight, and the stock-recruitment relationship. If the hypothesized relationship holds, and the Cold Pool Index continues to warm due to global climate change, the ability of this stock to support a fishery is questionable. This Management Track assessment followed the approach used in the previous assessment to calculate long-term reference points assuming recruitment remained within the range observed since 1990. If instead recruitment declines in the future, these already low biomass and yield estimates will decrease, providing little potential yield to the fishery.
- •
Does this assessment model have a retrospective pattern? If so, is the pattern minor, or major? (A major retrospective pattern occurs when the adjusted SSB or FFull lies outside of the approximate joint confidence region for SSB and FFull).
The 7-year Mohn’s ρ, relative to SSB, was 0.63 in the 2019 assessment and was 2.43 in 2021. The 7-year Mohn’s ρ, relative to F, was −0.31 in the 2019 assessment and was −0.62 in 2021. There was a major retrospective pattern for this assessment because the ρ-adjusted estimates of 2021 SSB (SSBρ= 70) and 2021 F (Fρ= 0.082) were outside the approximate 90% confidence regions around SSB (148–405) and F (0.019–0.053). A retrospective adjustment was made for both the determination of stock status and for projections of catch in 2023. The retrospective adjustment changed the 2021 SSB from 241 to 70 and the 2021 FFull from 0.032 to 0.082.
- •
Based on this stock assessment, are population projections well determined or uncertain? If this stock is in a rebuilding plan, how do the projections compare to the rebuilding schedule?
Population projections for Southern New England/Mid-Atlantic yellowtail flounder are uncertain for reasons associated with the retrospective pattern and the low stock size. The 2021 estimate of SSB is within the bounds of the projected SSB from the 2019 assessment, but the ρ-adjusted SSB is not. The 2019 estimate of SSB from the current assessment is below the 2019 ρ-adjusted SSB from the 2019 assessment, indicating the ρ-adjustment applied in the 2019 assessment was not large enough. However, the current low size of this stock makes these comparisons tenuous. This stock is in a rebuilding plan with a rebuilding date of 2029.
- •
Describe any changes that were made to the current stock assessment, beyond incorporating additional years of data and the effect these changes had on the assessment and stock status.
Minor changes, in addition to the incorporation of new data, were made to the Southern New England/Mid-Atlantic yellowtail flounder assessment for this update. The larval index was treated differently to now use SSB weights-at-age, tuned to the spawning time of the stock instead of the survey time, and used a fixed selectivity pattern equal to the maturity ogive (assumed constant over time in the assessment). These changes more closely reflect the use of the larval index as an indicator of spawning biomass, but had no noticeable impact on the results. The number of fishery selectivity blocks was reduced from 6 to 2 after consideration of a range of alternatives. All of the selectivity block changes produced similar patterns in the residuals (except for using only a single selectivity block), and all showed similar patterns in F and SSB. The decision to change from 6 to 2 selectivity blocks was based on model parsimony.
- •
If the stock status has changed a lot since the previous assessment, explain why this occurred.
The overfishing status of Southern New England/Mid-Atlantic yellowtail flounder has not changed since the last 2019 Management Track assessment. The stock remains at low abundance despite low catches.
- •
Provide qualitative statements describing the condition of the stock that relate to stock status.
All three 2021 surveys for Southern New England/Mid-Atlantic yellowtail flounder show record low numbers of fish caught, 2, 3, and 2 in the NEFSC spring, NEFSC fall, and larval surveys, respectively. The 2022 NEFSC spring survey, which is not included in this assessment, caught 3 fish. These surveys were all conducted according to standard operating procedures, so the low numbers of fish caught indicate a low population size, not a problem with the surveys. While lowfishery catches do not necessarily mean the population is low, the recent catches of < 10 mt in every year since 2019 are consistent with a low population size. There are no indications that this stock is doing well.
- •
Indicate what data or studies are currently lacking and which would be needed most to improve this stock assessment in the future.
The Southern New England/Mid-Atlantic yellowtail flounder assessment has been used as an example of how to include environmental factors in stock assessments in a number of recent papers (Miller et al. 2016, Xu et al. 2017, Stock and Miller 2021, du Pontavice et al. 2022). All indicate that the environment for this stock is getting worse and causing expected recruitment to decline as the temperature increases in the region. If this trend continues, as expected under nearly all climate models, then the ability of this stock to support a fishery is questionable. Converting the modeling framework for this stock from ASAP to WHAM (or another state-space model) would allow estimation of the relationship between environmental factors and modeled recruitment. The long-term potential yield of this stock associated with climate change could then be considered. A research track assessment for yellowtail flounder stocks in this region is scheduled to begin next month and be peer reviewed in 2024.
- •
Are there other important issues?
The catchability (q) survey biomass from the Cooperative Research comparative chain sweep experiment (Miller 2013, Jones et al. 2021) estimated similar biomass to the 2021 ρ-adjusted SSB from the assessment, but indicated a much higher biomass than the model-estimated SSB in the 2010s. When these data were used directly in the stock assessment, either the model q was unreasonably high (6 or 10 instead of the expected value of 1) or else there were major problems with the fits to the data. The decline in the expanded survey biomass from 2010 through 2019 cannot easily be explained given the catches and age structure of the fish caught. Future research should explore whether an alternative modeling platform, such as WHAM (Stock and Miller 2021), can find a way to reconcile these data with modeled population estimates.
16.1. Reviewer Comments: Southern New England/Mid-Atlantic yellowtail flounder
The 2022 assessment for Southern New England/Mid-Atlantic yellowtail flounder (Limanda ferrug- inea) updates the 2012 benchmark assessment use of the ASAP model (NEFSC 2012)2626 NEFSC. 2012. 54th Northeast Regional Stock Assessment Workshop (SAW 54) Assessment Report. US Dept Commer, NOAA Fisheries, Northeast Fish Sci Cent Ref Doc. 12-18.; 600p.CRD12-18 with additional commercial fishery catch data, five research survey indices of abundance, and reference points through 2019–2021. Stock projections have been updated through 2025.
Retrospective adjustments were made to the ASAP model. Spawning stock biomass in 2021 was estimated to be 70 mt which is 4% of the biomass target (SSBMSY= 1,715 mt). The 2021 fully selected fishing mortality was estimated to be 0.082 which is 23% of the overfishing threshold proxy (FMSY proxy= 0.349).
Based on this updated assessment, the SNEMA yellowtail flounder stock was overfished but overfishing was not occurring.
Short term projections of biomass were derived by sampling from an empirical cumulative distribution function of 30 recruitment estimates (1990–2019) from the ASAP model results based on recent estimates of recruitments from the model time. The annual fishery selectivity is from the most recent selectivity block in the model, the maturity ogive is the same as assumed for all years in the model, and mean weights-at-age are from 2014–2019 due to low or no sampling in 2020 and 2021. Retrospective adjustments were applied in the projections.
The estimated catch for 2022 is 4 mt, which results in catch advice of 55, 84 and 152 mt for 2023–2025 respectively.
The Panel was very impressed by the amount of work devoted to a stock with its biomass close to the origin.
The Panel was again concerned about the limited sampling for WAA for this stock.
There was concern that the outyear catch advice was overly optimistic given the stock’s current biomass and observed failure to recruit. Much of this increase seems to have been fueled by the low fishing pressure and simulated recruitment, which the model responds to by showing sharp increases in biomass. This could be exacerbated by the low sampling in 2020–2021.
Given the status of this stock, NOAA should be sure to provide a timely stock assessment update, and not allow the timing of the species’ Research Track effort interfere with this update.
The Panel concluded that the 2022 assessment update for SNEMA yellowtail flounder fulfilled the recommendations of the AOP, is technically sufficient to evaluate stock status and provide scientific advice and meets the Terms of Reference for the stock’s assessment. The assessment represents Best Scientific Information Available (BSIA) for this stock for management purposes.
References:
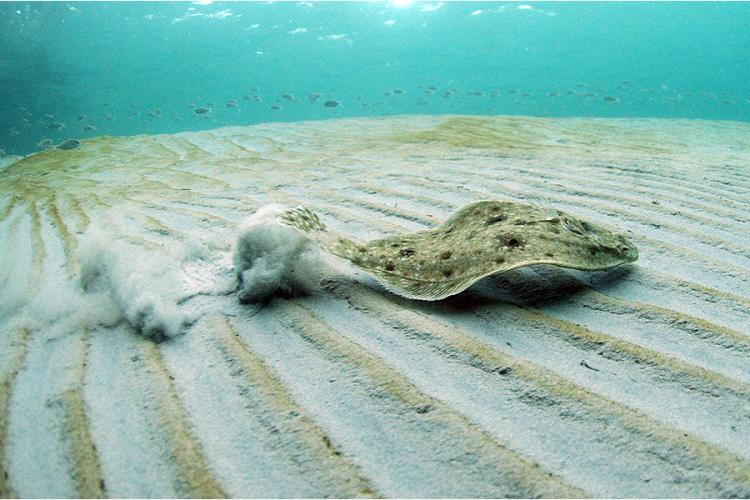
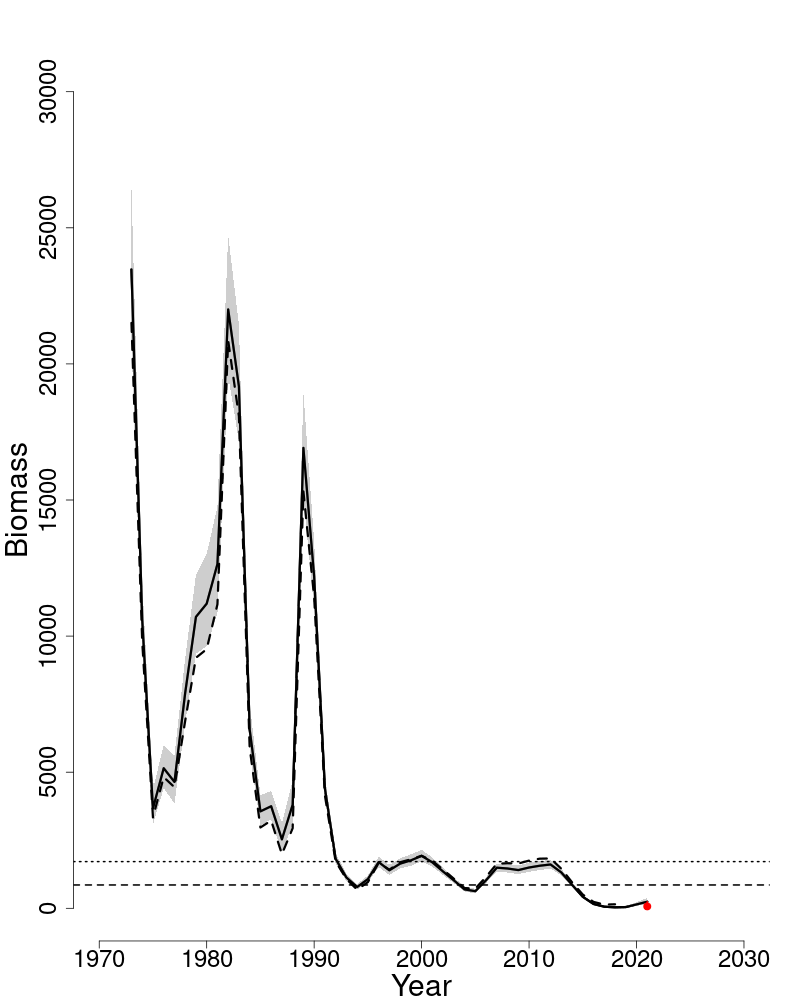
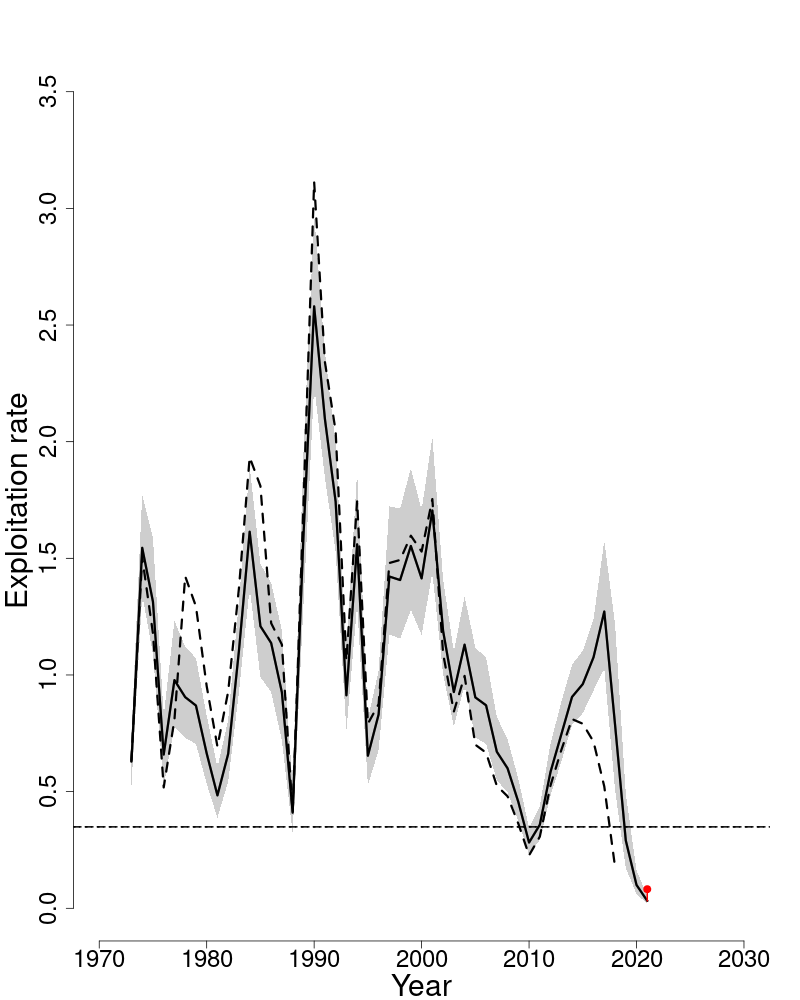
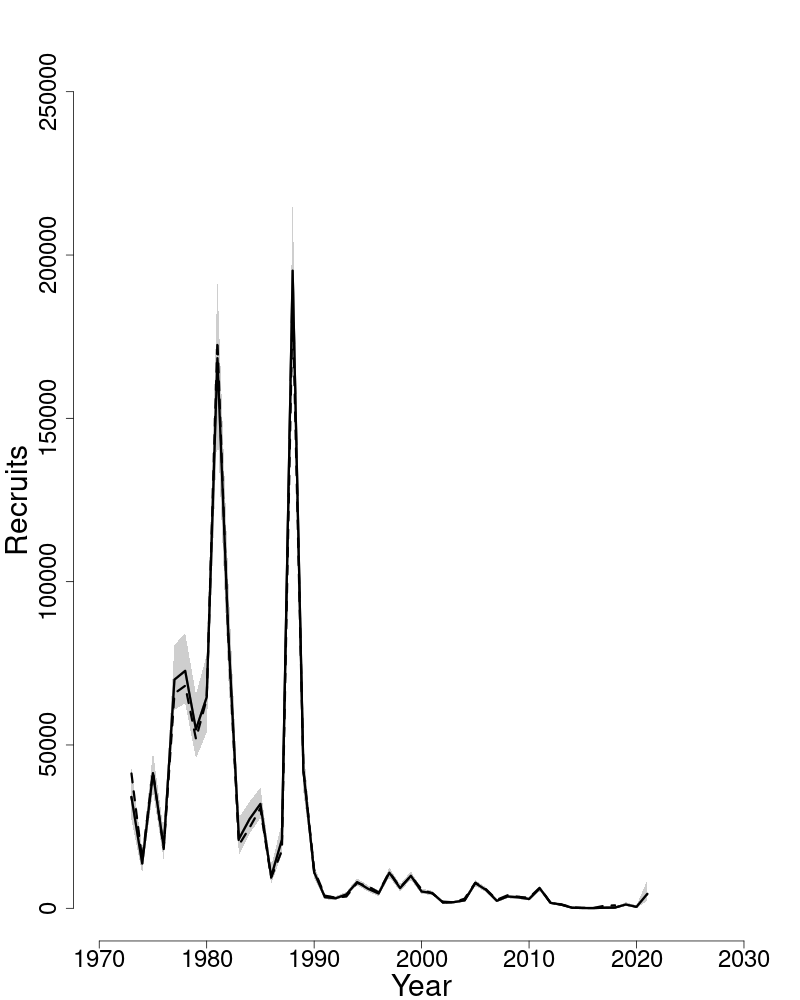
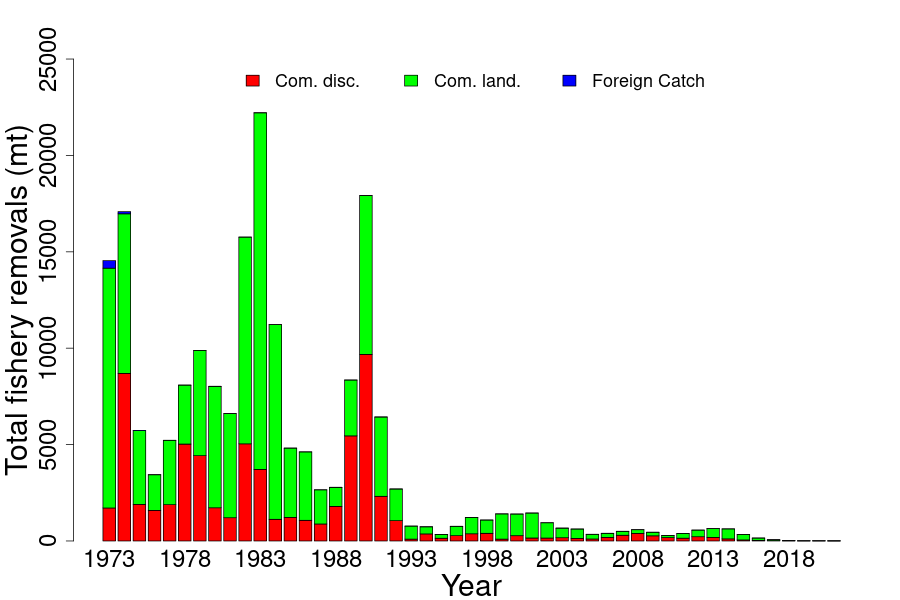
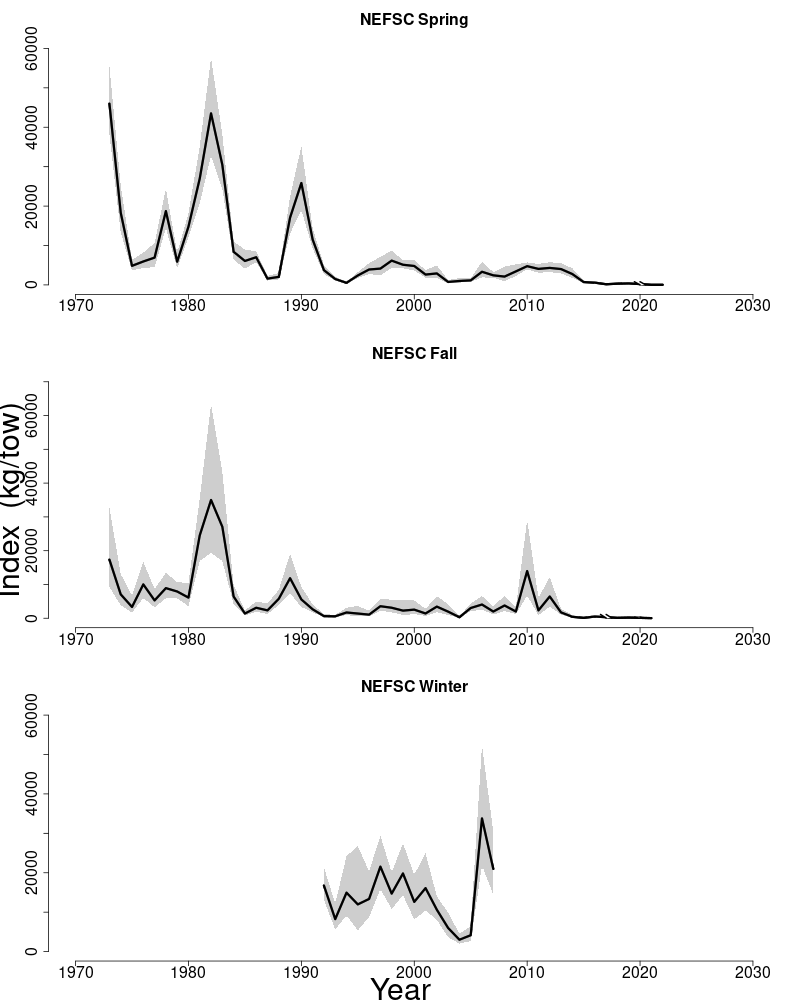
Photo Gallery
Here we provide descriptive text for the photographs and artwork that are scattered throughout the preceding pages.
-
Archival drawing: American Plaice. Photo NOAA. On page 115
-
Pollock in a basket. Credit: NOAA Photo Library. On page 128
-
NOAA research vessel Henry B. Bigelow, named after Henry Bryant Bigelow (1879–1967), oceanographer and marine biologist. Photo from NOAA website . On page vii
-
Sorted Haddock in baskets. Photo NOAA. On page 65
-
Haddock swimming over rocky bottom. Photo NOAA. On page 53
-
Atlantic Halibut on deck of fishing vessel. Photo NOAA. On page 75
-
Monkfish at gravelly sea bottom. Photo credit: iStock. On page 101
-
Monkfish on the measuring table. Photo: NOAA Teacher at Sea. On page 95
-
Aerial view of the NMFS building and surrounds, Woods Hole Laboratory, MA. The enclosed body of water behind is Eel Pond. Photo WHOI. On page 17
-
The reason behind it all: seafood display case at a local supermarket. Photo NOAA. On page iv
-
Fresh seafood on ice, ready for sale. Credit: Shutterstock. On page 165
-
Shrimp, mussels, scallop, and fish dish. Credit: iStock. On page ii
-
Brian Gay of Millsboro, Delaware holding the record-setting white hake he caught in 2019. Photo credit: Maryland Department of Natural Resources. On page 86
-
Aerial view of the buildings and wharves at the Woods Hole Oceanographic Institute, MA. Two research vessels are docked for re-supply. Photo WHOI. On page x
-
Displaying a Winter flounder catch. Photo credit: Willy Goldsmith. On page 42
-
Wolffish at floor of aquarium tank. Photo credit: Woods Hole Aquarium. On page 21
-
Yellowtail Flounder over sandy bottom. Photo credit: iStock. On page 158
-
Hippoglossus hippoglossus, commonly known as Atlantic Halibut, Halibut; range: New England/MidAtlantic. Artwork from NOAA halibut website . On page 73
-
Pollachius virens, commonly known as Atlantic Pollock, Saithe, Coalfish, Coley, Green cod, Boston bluefish; range: New England/Mid-Atlantic. Artwork from NOAA atlantic pollock website . On page 124
-
Melanogrammus aeglefinus, commonly known as Haddock, Scrod; range: New England/Mid-Atlantic. Artwork from NOAA haddock website . On page 51
-
Lophius americanus, also known as Goosefish, Monktails, Angler, Fishing frog, Allmouth, Molligut, Abbot, Sea-devil, Lotte; range: New England/Mid-Atlantic, Southeast. Artwork from NOAA monkfish website . On pages 93, 99
-
Urophycis tenuis, commonly known as White Hake; range: New England/Mid-Atlantic. Artwork from NOAA white hake website . On page 86
-
Pseudopleuronectes americanus, commonly known as Winter Flounder, Flounder, Sole, Lemon sole, Georges Bank flounder, Blackback flounder; range: New England/Mid-Atlantic, Southeast. Artwork from NOAA winter flounder website . On pages 32, 40
-
Anarhichas lupus, commonly known as Atlantic wolffish; range: New England/Mid-Atlantic. Artwork from NOAA wolffish website . On page 22
-
Limanda ferruginea, commonly known as Yellowtail Flounder, Flounder, Rusty dab; range: New England/Mid-Atlantic. Artwork from NOAA yellowtail flounder website . On pages 155
Procedures for Issuing Manuscripts in the Northeast Fisheries Science Center Reference Document (CRD) Series and the Technical Memorandum (TM) Series
The mission of NOAA’s National Marine Fisheries Service (NMFS) is “stewardship of the nation’s ocean resources and their habitat.” As the research arm of the NMFS’s Greater Atlantic Region, the Northeast Fisheries Science Center (NEFSC) supports the NMFS’s mission by “conducting ecosystem-based research and assessments of living marine resources, with a focus on the Northeast Shelf, to promote the recovery and long-term sustainability of these resources and to generate social and economic opportunities and benefits from their use.” Results of NEFSC research are largely reported in primary scientific media (e.g., anonymously-peer-reviewed scientific journals). However, to assist itself in providing data, information, and advice to its constituents, the NEFSC occasionally releases its results in its own media.
NOAA Technical Memorandum NMFS-NE
This series is issued irregularly. The series typically includes: data reports of long-term field or lab studies of important species or habitats; synthesis reports for important species or habitats; annual reports of overall assessment or monitoring programs; manuals describing program-wide surveying or experimental techniques; literature surveys of important species or habitat topics; proceedings and collected papers of scientific meetings; and indexed and/or annotated bibliographies. All issues receive internal scientific review and most issues receive technical and copy editing.
NORTHEAST FISHERIES SCIENCE CENTER REFERENCE DOCUMENT
This series is issued irregularly. The series typically includes: data reports on field and lab studies; progress reports on experiments, monitoring, and assessments; background papers for, collected abstracts of, and/or summary reports of scientific meetings; and simple bibliographies. Issues receive internal scientific review and most issues receive copy editing.
Clearance
All manuscripts submitted for issuance as CRDs must have cleared the NEFSC’s manuscript/abstract/ webpage review process. If your manuscript includes material from another work which has been copyrighted, then you will need to work with the NEFSC’s Editorial Office to arrange for permission to use that material by securing release signatures on the “NEFSC Use-ofCopyrighted-Work Permission Form.”
For more information, NEFSC authors should see the NEFSC’s online publication policy manual, “Manuscript/abstract/webpage preparation, review, and dissemination: NEFSC Author’s Guide to Policy, Process, and Procedure.”
Style
The CRD series is obligated to conform with the style contained in the current edition of the United States Government Printing Office Style Manual; however that style manual is silent on many aspects of scientific manuscripts. The CRD series relies more on the CSE Style Manual. Manuscripts should be prepared to conform with both of these style manuals.
The CRD series uses the Integrated Taxonomic Information System, the American Fisheries Society’s guides and the Society for Marine Mammalogy’s guide for verifying scientific species names.
For in-text citation, use the name-date system. A special effort should be made to ensure that all necessary bibliographic information is included in the list of references cited. Personal communications must include date, full name, and full mailing address of the contact.
Preparation
Once your document has cleared the review process, the Editorial Office will contact you with publication needs — for example, revised text (if necessary) and separate digital figures and tables if they are embedded in the document. Materials may be submitted to the Editorial Office as email attachments or intranet downloads. Text files should be in Microsoft Word, tables may be in Word or Excel, and graphics files may be in a variety of formats (JPG, GIF, Excel, PowerPoint, etc.).
Production and Distribution
The Editorial Office will perform a copy-edit of the document and may request further revisions. The Editorial Office will develop the inside and outside front covers, the inside and outside back covers, and the title and bibliographic control pages of the document.
Once the CRD is ready, the Editorial Office will contact you to review it and submit corrections or changes before the document is posted online. A number of organizations and individuals in the Northeast Region will be notified by e-mail of the availability of the document online.
Commercial and recreational discards, landings, and age composition were updated through 2021.
An issue with the commercial Numbers and Weight-At-Age (NAA/WAA) exists for 2021 in that only one ‘Large’ fish was sampled in 2021. Only 6% of the catch was Large, but the effect of this low sampling was investigated further by considering three solutions: 1) Assign all Large catch to the one observed length, 2) borrow the 2020 Large samples and expand them annually, and 3) borrow the 2020 Large samples and expand them quarterly. After examining NAA and its CV, and WAA, the analyst determined that use of the 2020 Large samples with quarterly expansion provided the most robust solution.