

1. 2023 MANAGEMENT TRACK PEER REVIEW PANEL REPORT
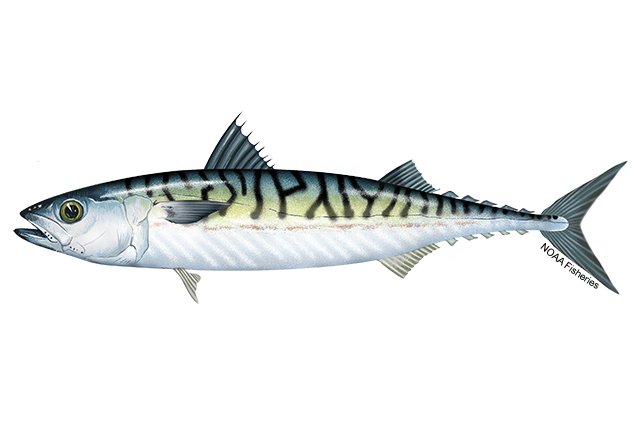
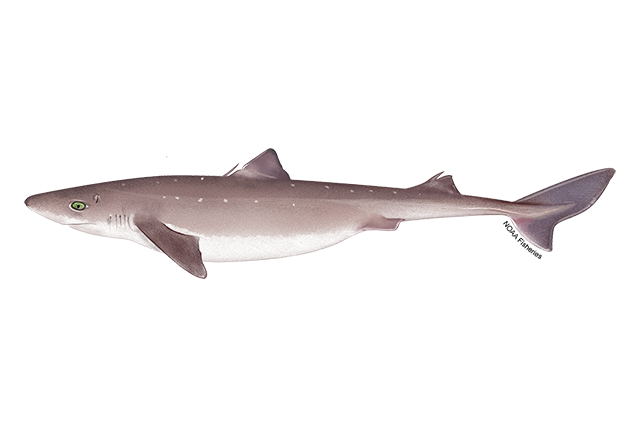
Five fish stock assessments were reviewed by the June 2023 Management Track peer review panel. All were Level 2 Expedited Reviews: deep-sea red crab (Chaceon quinquedens), scup (Stenotomus chrysops), longfin inshore squid (Doryteuthis (Amerigo) pealeii), summer flounder (Paralichthys dentatus), and bluefish (Pomatomus saltatrix). Spiny dogfish (Squalus acanthias) was identified as a Level 3 Enhanced review assessment during the AOP, but was not addressed during the June Management Track Peer Review meeting and instead will be reviewed during the September Management Track Peer Review meeting. Atlantic mackerel (Scomber scombrus) was elevated to a Level 2 Expedited Review as a result of a putative status change and will be reviewed in September. Levels of review were as recommended by the Assessment Oversight Panel (Appendix A).
The Peer Review Panel (Panel) for the June 2023 Management Track Assessments met via webinar on June 26–28, 2023. The Panel was to determine whether the completed management track assessment was technically sufficient to (a) evaluate stock status, (b) provide scientific advice and (c) successfully address the assessment Terms of Reference (Appendix B). Table 1 presents a list of the stocks, name of the lead analyst/presenters, and conclusions about stock status.
Attendance at the meeting is provided in Appendix C with the Agenda shown in Appendix D .
We thank Russ Brown (Population Dynamics Branch Chief) and Michele Traver (Assessment Process Lead) for their support during the meeting and to the staff of the Population Dynamics Branch at NEFSC for the open and collaborative spirit with which they engaged the Panel.
Our thanks also extend to the rapporteurs for taking extensive notes during the meeting and to staff of the Mid-Atlantic Fishery Management Council.
The Panel has suggestions for improvements that could be made for review of Management Track assessments:
- •
The Panel also has several crosscutting recommendations with respect to the individual stock assessments:
- 1.
For both summer flounder and bluefish, estimates of unusually high recruitment near the end of the time-series are propagated through the OFL projections, as these fish enter the fishery at relatively young ages (summer flounder are fully recruited to directed fisheries at age-4 and bluefish at age-2). If these recruitment events are overestimated (as the summer flounder event in 2018 turned out to be), the resulting OFL will be too high and may increase the risk of overfishing. The SSC may want to consider retrospectively adjusting anomalously high recruitment events near the terminal year of the assessment when doing OFL projections to mitigate this risk.
- 2.
The 2023 peer review of the Catch Accounting and Monitoring System ( CAMS ; O’Keefe et al. 2023) concluded, with some caveats, that CAMS can be implemented to provide a single source of commercial fishery data for the primary purposes of quota monitoring and stock assessment. Where presented during the review, the differences between the commercial landings from CAMS and from the previously used databases were minimal; differences in the estimates of commercial discards were somewhat greater, although the CAMS estimates were generally within the confidence intervals of the previous estimates. The differences could not be explained. The Panel recommends that future stock assessment updates continue to check CAMS estimates against current or historical estimates of discards and harvest, where available to ensure that the differences remain negligible.
- 3.
Reduction in Port sampling for individual lengths and age structures represents a significant threat to the stock assessment enterprise. NOAA should decide whether it can return Port sampling to levels comparable with those achieved prior to 2019. If they cannot, they should increase catch sampling by observers (either ASM or NEFOP) to balance the loss of these data.
- 4.
NOAA should continue to evaluate the use of dynamic reference points with analytic assessments.
Table 1: Stocks reviewed at June 2023 Management Track Assessment Peer Review meeting
| Stock | Lead Analyst/Presenter | Peer review conclusion |
|---|---|---|
| Deep sea red crab Expedited Review | Toni Chute | Stock’s overfished and overfishing status is unknown |
| Scup Expedited Review | Mark Terceiro | Stock is not overfished and overfishing is not occurring |
| Longfin inshore squid Expedited Review | Lisa Hendrickson | Stock is not overfished and overfishing status is unknown |
| Summer flounder Expedited Review | Mark Terceiro | Stock is not overfished and overfishing is not occurring |
| Bluefish Expedited Review | Tony Wood | Stock is not overfished and overfishing is not occurring |
Appendix A. Summary of Assessment Oversight Panel Meetings for February 2023 Management Track Stock Assessments
The NRCC Assessment Oversight Panel (AOP) met to review the operational stock assessment plans for Atlantic mackerel, bluefish, deep sea red crab, longfin inshore squid, spiny dogfish, scup and summer flounder stocks on February 23, 2023. One assessment was recommended for Level 1 Review (Direct Delivery) and this assessment will undergo an internal review before being delivered to the appropriate management body. The assessments for stocks/species recommended for Level 2 and 3 peer reviews will be reviewed during the peer review meeting scheduled for June 26–30, 2023.
The AOP consisted of:
Meeting Details:
These meetings were guided by the NRCC approved stock assessment guidance documents. Background documents were provided to the Panel: (1) an updated prospectus for each stock; and (2) an overview summary of all the salient data and model information for each stock. Prior to the meeting, each assessment lead prepared a proposal for their Management Track Assessment. The proposal reflected the research track or most recent assessment results, the peer review panel Summary Report results, and any initial investigations conducted for the management track assessment.
At the meeting, each assessment lead gave a presentation on the data to be used, model specifications (if applicable), evaluation of model performance, the process for updating the Biological Reference Points, the basis for catch projections, and an alternate assessment approach if their analytical assessment is rejected by the peer review panel.
Major Recommendations for Review of Individual Stocks
In general, the AOP approved the plans presented, but recommended several points of emphasis to the recommended review levels as summarized in Table 2 below. AOP guidelines can be found in thestock assessment process document .
Table 2: Stocks reviewed at February 2023 Management Track Assessment Stock Assessments meeting
| Stock | Lead | Review Level | Rationale and Comments |
|---|---|---|---|
| Atlantic mackerel | Kiersten Curti | Level 1 Direct Delivery (Provisional) | The assessment will be updated with three years of data (2020–2022). There are questions about the availability of the 2022 egg/biomass index. If the 2022 egg/biomass index is not available, the review level should be elevated to Level 2. Ecosystem and Socioeconomic Profile will be provided as supplementary information. Ismooth approach will be used as an alternate assessment approach. |
| Bluefish | Tony Wood | Level 2 Expedited Review | A Research Track assessment was completed in December 2022, which updated the previous ASAP model to a state space WHAM model. The Management Track assessment will add one additional year of data. Guild approach used to modify the CPUE index and represents a novel approach. Significant change in constant natural mortality to age based natural mortality. SSB target has been reduced by 50%. Regional estimation of discard weights, which accounts for regional differences. |
| Deep-sea red crab | Toni Chute | Level 2 Expedited Review | Data poor species with no assessment model. This assessment will add 4 years of data (2019–2022). No issue with missing 2020 data since there were reported catches and some observed trips. The sexes segregate by depth and the fishery targets areas with higher densities of males. During the CAMS review, there were issues with the discards for some gear types. CAMS data are not used in the data update. A tagging project had low return rates indicating the potential for high mortality of tagged individuals, or a super abundant population. A Level 2 review of the available data and to highlight the limitations of analyses that have been attempted for this species is recommended to suggest potential approaches and generate useful research recommendations. |
| Longfin inshore squid | Lisa Hendrickson | Level 2 Expedited Review | This assessment will use the same methods as 2020 Management Track assessment including updating annualized BMSY proxy and BThreshold with data, but will explore changing the baseline time period from 1976–2022 to 1997–2022. This change in the time period is a primary reason for recommending a Level 2 review. The AOP would like to see results for both time periods presented to the peer review panel. The AOP panel would like to see consideration of any changes caused by the CAMS transition. Research recommendations from the peer reviewers will be important to contributing to the work of the planned 2026 Research Track assessment. |
| Spiny dogfish | Dvora Hart | Level 3 Enhanced Review | A Research Track assessment was completed in December 2022, which updated the previous stochastic estimator (swept area calculations) to a length based Stock Synthesis 3 model. The Management Track assessment will add three years of data (2020–2022). There was a significant change in natural mortality (Lorenzen M), which resulted in a reduction in the females reaching maturity. There is a significant change in the length at maturity. There is a chance that there could be a status change to overfished. The AOP encourages a careful look at the impacts of transitioning to the use of CAMS catch (landings and discards). The AOP recommends reporting the fishing mortality rate and biomass estimates for the male component of the population. |
| Scup | Mark Terceiro | Level 2 Expedited Review | The management track will add three years of updated catch for 2020–2022 (CAMS landings and discards; MRIP recreational). CAMS discards have a lot of uncertainty and it is unclear what the format of that data will look like and when they’ll be available. Revision to NEFSC Bigelow indices (“by-tow” swept area). Minor changes in model input settings (CV, ESS). Near threshold for retro adjustments. Projections carrying forward using previously reviewed methods. |
| Summer flounder | Mark Terceiro | Level 2 Expedited Review | The assessment will update the fishery and survey catches for 2020–2022 using CAMS estimates of landings and discards. It will revise the NEFSC survey indices for 2009–2022 to include area swept adjustments by tow. In terms of model adjustments, plan to inflate input CVs of a few survey indices (CT spring, NEAMAP fall, Bigelow fall) and recenter input catch ESS to improve model diagnostics. Also plan to test split of terminal fishery selectivity blocks from 2008–2022 to 2008–2015 and 2016–2022. |
Individual Stock Discussion Summaries:
Atlantic mackerel (AOP Lead: Cate O’Keefe)
Recommendation: Level 1 (Direct Delivery, Provisional)
Atlantic mackerel were last assessed in 2021 via a Management Track assessment; the most recent benchmark was in 2017 at SAW 64. 2021 results indicated the stock was overfished based on SSB in 2019 (42,862 mt) being 24% of the SSBMSY proxy (SSB40%= 181,090 mt), and overfishing was occurring based on F2019 (0.46) being 208% of the FMSY proxy (F40%SPR= 0.22). The assessment included three indices: the NMFS Spring bottom trawl survey Albatross years from 1968–2008; the NMFS Spring bottom trawl survey Bigelow years from 2009–2019; and a range wide SSB index for 1977–2019 developed from the Canada DFO dedicated egg survey and the NEFSC MARMAP and ECOMON surveys. The assessment assumed constant natural mortality (M= 0.2) and included one fishery fleet with time-invariant, flattopped selectivity.
Kiersten Curti presented the proposed assessment plan for Atlantic mackerel in 2023, which will use the current ASAP model configuration with no changes and updated fishery and survey data through 2022. CAMS estimates of commercial landings and discards will be used for 2020–2022. Survey updates will include the 2021 and 2022 NMFS Spring bottom trawl survey (2020 survey was not conducted) and the SSB index for 2021 and 2022, if available. Reference points will be updated using the SAW 64 projection approach with MSY level proxies of F40%SPR and SSB40%. Rebuilding projections for 2023–2024 will be based on an assumed bridge year catch in 2023, two-stanza recruitment, and FRebuild= 0.12 as defined in the Atlantic Mackerel Rebuilding Amendment 2.0. The proposed backup assessment approach is the Ismooth method using the SSB index developed from egg surveys.
The AOP raised questions about DFO data to support the SSB index and availability of data to support the assessment. Dr. Curti explained that the 2020 SSB index will be treated as missing, the 2021 SSB index is available, and the 2022 samples to support the SSB index are currently in transit. She expects that the 2022 SSB index will be available to support the assessment but noted that delays are possible. The AOP asked about model sensitivity to terminal year estimates and suggested that sensitivity analysis to examine the impacts of missing the terminal year SSB index may be warranted if the index is not available. The AOP also noted that this is the first iteration of the Atlantic mackerel assessment using CAMS data and recommended comparisons of CAMS landings and discards to outputs from previous methods to assess any substantial differences.
The AOP raised questions about application of the two-stanza recruitment assumptions for reference points and projections. Dr. Curti highlighted previous deliberations by the 2021 Management Track assessment process and the SSC. She noted that there is no clear evidence of environmental conditions impacting recruitment. Despite high adult condition since the mid-2010s, recruitment has been low, but Dr. Curti indicated there is little evidence of a shift in environmental conditions. Research in Canada has indicated that SSB and temporal/spatial overlap of larvae with preferred prey are significant drivers of strong year classes. Without clear evidence that recruitment is environmentally driven, the 2021 Management Track assessment did not change the SAW 64 assumptions for reference points and there are no proposed changes for the 2023 Management Track assessment.
The AOP supported continued development of the Ecosystem and Socioeconomic Profile (ESP) for Atlantic mackerel, which describes ongoing examinations of natural mortality and stock productivity. The ESP will be provided as supporting information in 2023 and results to date do not indicate that changes to the assessment model are warranted.
The AOP recommended a provisional Level 1 review for Atlantic mackerel. The AOP supported a direct delivery of the assessment to the SSC based on the proposal to maintain the model configuration and update three years of fishery and survey data. The SSC recommended that a Level 2 review may be warranted if the 2022 SSB index is not available for the assessment update or if large differences in CAMS data are detected. The NEFSC will consider all available data in the coming months and determine if the review needs to be elevated to a Level 2.
Bluefish (AOP Lead: Russ Brown)
Recommendation: Level 2 (Expedited Review)
Bluefish was last assessed in the Management Track in 2021 with data updated through 2019. That assessment utilized an ASAP statistical catch at age model to conclude that the stock was overfished, but overfishing was not occurring. Bluefish completed a Research Track assessment that was peer reviewed in December 2022. The newly accepted assessment developed a WHAM state space statistical catchat-age model with deviations on the numbers at age estimates. Natural mortality, which was previously assumed constant at age-2, is now assumed to vary by age. The model employs two fishery fleets (recreational landings & discards and commercial landings), and 5 fleet selectivity blocks (2 commercial and 3 recreational). Three new indices were added to the model: MRIP CPUE Guild Approach index (1985–2021), SEAMAP Age-1 (1989–2021) and CHESMAP Trawl survey (1985–2018). The 2022 Research Track assessment (data through 2021) concluded that the stock was not overfished and overfishing was not occurring.
The 2023 Management Track assessment will update the current Research Track assessment with one year of additional data (2022). To address concerns of Research Track peer reviewers, the assessment will shift from full multinomial age length keys to only using multinomial approaches to fill in holes in age length keys (consistent with the approach used by StockEff). This may allow for exploration of alternate likelihoods for age compositions.
The assessment update will conduct short term projections in WHAM, which allows for incorporation of model uncertainty, auto-regressive processes and uncertainty in recruitment and numbers-at-age. Removals in 2023 will be assumed to be equal to the 2023 ABC (13,890 mt) and projections will be carried forward for years 2024–2026.
The AOP was concerned that the spawning biomass target has declined by 50% and is likely caused by changes in M using the Lorenzen curve resulting in a reduction in the recruits to fishable sizes. However, the previous target had never been achieved in the fishery and was likely overinflated. This approach may represent a more reasonable level of reference points. It was noted that the SSC was concerned that the average weight of discards has disparities between the MRIP and angler surveys, likely due to higher average weights of large discarded fish. It was noted that the NEFSC and GARFO have agreed to use the same values in setting specifications. Previously, the approach was overestimating discards, particularlyin the south (southern fish are generally smaller). The use of regionally stratified estimates is considered to be a more realistic and appropriate approach. The AOP recommended a Level 2 review for bluefish due to the significant reduction in the biomass target and proposed changes to the age-length key approach.
Deep-sea red crab (AOP Lead: Russ Brown)
Recommendation: Level 2 (Expedited Review)
Deep-sea red crab is a data poor species that has not been considered in previous Management Tracks. A specifications update was completed in 2019 to set specifications for fishing years 2020–2023. This update included a time series from 2002–2019 including landings data from the limited access fleet, incidental landings, LPUE estimates for the limited access fleet and biological information from port samplers and observed trips. There is no assessment model, no biological reference points for this stock and none will be developed during this Management Track cycle.
This data update will add 4 years of data (2019–2022) including landings; LPUE estimates; port sampled carapace lengths for landed males; observer sampled carapace lengths for males; females and discarded males; and observer data on egg-bearing females and discards. There are no issues with missing 2020 survey data since the update relies on reported catches and some observed trips. The sexes segregate by depth and the fishery targets areas with higher densities of males. During the CAMS review, there were issues with the discards for some gear types. However, CAMS data are not used in the data update. A tagging project had low return rates indicating the potential for high mortality of tagged individuals, or a super abundant population. A Level 2 review of the available data and to highlight the limitations of analyses that have been attempted for this species is recommended to suggest potential approaches and generate useful research recommendations.
Longfin inshore squid (AOP Lead: Paul Rago)
Recommendation: Level 2 (Expedited Review)
Longfin squid was last assessed in 2020 at a Management Track assessment. The overfishing status was unknown, but the stock was not overfished. The “not overfished" status was based on a comparison of the average of the 2018 and 2019 annualized, q-adjusted swept area biomass estimates (i.e., averages of the NEFSC spring and fall survey biomass for each year), 63,349 mt, to the threshold BMSY proxy (BThreshold) based on a long-term average (1976–2019). The threshold BMSY proxy is 50% of the BMSY target (i.e., 0.5×42,405 mt= 21,203 mt). It was also noted that the NEAMAP fall survey biomass estimates are added to those from the NEFSC fall survey.
Lisa Hendrickson’s presentation highlighted the complexity of longfin squid life history and the seasonal nature of the fishery which has both inshore and offshore components. Unlike Illex squid, longfin squid are neritic (i.e. residents of shelf waters). Hence, both the spring and fall NEFSC bottom trawl surveys likely sample most of the stock inhabiting US waters. The SARC 51 (2010) assessment approach considered the seasonal dynamics of the fisheries by calculating exploitation rates (catch/survey biomass) between the seasonal surveys. SARC 51 concluded that annualized survey biomass estimates were more appropriate. Dr. Hendrickson noted cohort-based estimates of biomass and exploitation rates have alwaysbeen computed for squid caught in the spring versus fall surveys because the two cohorts have different growth rates and productivity levels. Although an approach based on analyzing each intra-annual cohort independently would be more realistic since it would capture the reliance of summer and fall fisheries on the recruits produced from the spring stock estimates, this approach has been deemed not permissible under the Management Track and will be suggested for exploration under the next Research Track. Similarly, the winter and spring fisheries depend on recruits produced from the fall survey stock estimates. Such a model would also allow inclusion of seasonal differences in growth rates.
Dr. Hendrickson recommended a change in the time series used to compute the BMSY average from 1976–2008 to 1997–2022. The rationale was based on consideration of rapid warming and other changes in environmental conditions, and possibly productivity in recent years. Changes in fleet characteristics, data quality (i.e. mandatory fishery data reporting as of 1997), and in-season management as of 2000 were also considered relevant by the assessment lead to this proposed change. Questions from the AOP addressed the basis for the proposed change in years to compute the BMSY average and whether there was any evidence of trends in the surveys. No trends have been observed but further analyses are needed. The selection of appropriate stanzas of years for projections or measures of productivity are always controversial, so justifying any changes should be data driven and well supported.
Additional questions from the AOP and other meeting attendees included the methods used to estimate catchability in the trawl surveys, comparisons with assessments of species similarly impacted by environmental changes (e.g., Atlantic mackerel), and whether any preliminary changes had been detected. To account for diel vertical migrations, abundance and biomass estimates are based on daytime tows where “daytime" is defined by solar zenith angle because the species is most available to bottom trawls during the daytime. These values vary with location and date. The exclusion of tows outside the solar zenith angle ranges for the NEFSC spring and fall surveys reduces the frequency of low and zero tows, and generally improves precision but also reduces sample sizes within strata. The NEAMAP fall trawl survey swept area estimates will be updated because they are added to those of the NEFSC fall surveys. The NEAMAP spring survey’s intermittent encounters of longfin squid are attributed to varying availability of squid to the survey area; the stock is generally farther offshore in the spring.
Collectively, these considerations led the AOP to recommend a Level 2 review and a continuation of the current assessment methodology. The selection of an alternative basis for the BMSY average should be fully explored and compared to the existing span of years. Results of both approaches should be presented to the MTA reviewers. The inclusion of newly developed CAMS estimates of landings and particularly discards, should be fully explored. Finally, MTA review can lay the groundwork for the Research Track assessment now scheduled for 2026. The groundwork could include any pending or required research on basic biology, alternative modeling approaches, and required data streams from the commercial fleets. The Terms of Reference for the assessment have not been set; the newly chartered Research Track Steering Committee of the NRCC will likely be involved in this process.
Spiny dogfish (AOP Lead: Cate O’Keefe)
Recommendation: Level 3 (Enhanced Review)
A Research Track assessment for spiny dogfish was peer reviewed in December 2022. The Stock Synthesis 3 (SS3) model was used with a time series of 1989–2019. The stock was not overfished based onReproductive Output in 2019 (239.9 million pups) being 65% of the SSBMSY proxy (Reproductive Output Target = 370.8 million pups), and overfishing was occurring based on F2019 (0.032) being 128% of the FMSY proxy (F60%SPR= 0.025). The assessment included the NMFS Spring and Fall bottom trawl survey indices and lengths, two landings fleets and three discard fleets, Lorenzen natural mortality estimates, and two maturity-growth relationship blocks. Dvora Hart presented the proposed assessment plan for spiny dogfish in 2023, which will use the current SS3 model configuration with explorations and potential modification to the influence of the stock-recruit relationship and updated fishery and survey data through 2022. CAMS and SBRM derived estimates of commercial landings and discards and MRIP estimates of recreational landings will be used for 2020–2022. Landed and discarded length and sex data by gear type will be updated based on available information. Survey updates include the 2021 and 2022 (2020 survey was not conducted) NMFS Spring and Fall bottom trawl survey indices and lengths. Reference points will be updated using the Research Track approach with MSY level proxies based on SPR60%. The projection method will be investigated to consider disproportional landings and discards. The proposed backup assessment approach is the previously used Stochastic Estimator model, which estimates F and SSB using swept area from the NMFS Spring survey with propagation of uncertainties.
The AOP raised questions about the backup assessment plan and potential challenges with applying reference points from the SS3 model to the outputs from the Stochastic Estimator model. The AOP noted that it is unlikely that the SS3 model would be rejected during the Management Track Peer Review as it was recently approved during the Research Track assessment. Dr. Hart noted that the new BRPs were approved through the Research Track assessment and would remain in place. The AOP asked about the influences of changes in natural mortality assumptions and age information included in the SS3 assessment. Dr. Hart commented that the use of the Lorenzen M provides better results from the model and is more biologically realistic. Estimates of M range from 0.3 for newborn pups to 0.08 for large adult females, which influence the per recruit calculations and result in less females reaching the reproductive age. She noted that the only ageing study with a large scope was conducted ≈40 years ago and there is evidence that growth rates have changed. Length at maturity has decreased suggesting that either growth has slowed, or females are maturing at earlier ages. Smaller, slower growing females indicate reduced reproductive output. The 2022 Research Track assessment suggested that reproductive output has rapidly declined in recent years, and the stock may be approaching an overfished status.
The AOP and other meeting attendees inquired about providing estimates of F and biomass for males. Dr. Hart commented that this question has been raised in the past and she could provide these estimates but does not propose deriving reference points for males.
The AOP recommended a Level 3 review for spiny dogfish. The AOP supported the proposed explorations and potential changes to the assessment and recommended that ample time be allotted for presentation and review during the Management Track Peer Review. The AOP noted the need for review of CAMS data and the potential for a change in stock status. They also highlighted that the 2023 Management Track is the first iteration of the SS3 assessment since the Research Track in 2022 and highlighted major changes in estimates of natural mortality and length at maturity.
Scup (AOP Lead: Paul Rago)
Recommendation: Level 2 (Expedited Review)
Scup were most recently assessed in 2021 via a Management Track assessment; the most recent benchmark assessment was in 2015 at SAW 60. Mark Terceiro presented the proposed assessment plan for scup in 2023 that will rely on the model structure (ASAP) but include updated fishery and survey data through 2022. CAMS estimates of commercial landings and discards will be used for 2020–2022, but questions remain about the commercial discard estimates. NEFSC trawl survey indices will include “by tow" area swept estimates but the effect of such changes on general trends are negligible. Some minor changes in tuning parameters will be used to improve model diagnostics. These parameters include the Coefficients of Variation (CV) for some state abundance indices. Population projections will assume a catch in 2023 equal to the approved ABC of 13,458 mt.
The AOP inquired about the potential effects of missing NEFSC survey data in 2020 and the effects of large year classes now moving into the plus group of the population. Such factors can increase the likelihood of retrospective patterns. Dr. Terceiro acknowledged these concerns and noted that noisy indices might cause problems in future years. The model also includes a dome shaped selectivity pattern for the fishery. This creates a large “cryptic" biomass. Consideration of age-based natural mortality rates might be necessary in future benchmarks for this species.
Additional questions from the AOP inquired about the potential utility of methods to aggregate several indices to detect relative abundance and trend. Dr. Terceiro noted that various GLM approaches had been explored but previous reviewers expressed concerns about over-smoothing of abundance estimates outside of the assessment model. In theory, modern models are designed to address competing signals in the composite likelihood function, but they do not address the spatial arrangement of the indices or their covariance. Recent recruitment indices have been low, but attempts to estimate a parametric stock recruitment relationship have not been successful. The low values in recent years do not seem sufficient to support a change in the stanza of years used for stock and catch projections. Moreover, in view of Dr. Terceiro’s responsibilities for summer flounder at the June MTA, the analyses to justify such a change are unlikely to be completed.
No RTA are currently planned for scup but likely topics for consideration include the aforementioned topics of age-specific M and aggregation of young of the year indices as well as concerns about discard estimates in the earlier decades of the assessment. The model currently starts in 1963, but estimates of age structure only began in 1984. There appears to be sufficient contrast in recent survey indices such that the earlier years of the time series could be dropped. The tradeoff between contrast in the surveys and uncertainty in the discards and age composition of earlier years may justify truncation at an RTA. The AOP unanimously endorsed a Level 2 review for Scup.
Summer flounder (AOP Lead: Mike Celestino)
Recommendation: Level 2 (Expedited Review)
The currently approved stock assessment model for summer flounder is a 2021 Management Track assessment (MTA) with data through 2019, that builds on the 2018 SAW 66 benchmark assessment. This is an ASAP model with four fishery fleets, three selectivity periods, and a variety of federal, state, and academic fishery surveys. Results of the 2021 MTA indicated the stock is not overfished, and overfishing is not occurring.
New sources of information considered for the 2023 MTA include an update of fishery and survey catches for 2020–2022. CAMS will be queried for commercial landings and discards for these same years; Mark Terceiro noted that preliminary comparisons of SBRM and CAMS for 2018–2021 were within 10%, likely due to differences in stratification, while differences in landings were trivial. Revision of the NEFSC trawl survey indices for the Bigelow years (2009–2020) to include “by-tow” swept area calculations are also proposed. Model configuration changes that are proposed as part of this MTA include changes to survey input CVs and adjustments to input catch ESS; each expected to have minor changes on assessment results, but result in improved model diagnostics. Dr. Tercerio noted that if time allows (depending on exactly when data are available), he will experiment with splitting the terminal fishery selectivity blocks from 2008–2022 to 2008–2015 and 2016–2022 to determine impacts on model performance.
Consistent with past summer flounder assessments, BRPs will be derived from projections that include recruitment estimates that use the entire time series (1982–2022), while OFL projections will extend the SSC-recommended low-recruitment time series that started in 2011 (2011–2022). For 2024–2025 OFL projections, Dr. Terceiro will assume catch in 2023 as the final ABC (15,023 mt), and follow MAFMC risk policy for ABC (e.g., OFL CV = 60%).
Dr. Terceiro is proposing as a backup assessment plan, should one be necessary, of either recent trends in all normalized survey indices (e.g., the SSC data update procedure) or Ismooth using the NEFSC Bigelow spring and fall indices.
The AOP further inquired about the source(s) of differences between SBRM and CAMS, to which Dr. Terceiro noted that the differences were not consistent in one direction and that further diagnosis of specific differences will require a line-by-line, stratum-by-stratum examination of discards; he noted there may not be sufficient time to perform that analysis. The AOP noted that highlighting differences to the review panel could be helpful. The AOP supported extending the low recruitment timeseries for OFL projections but inquired as to whether there was a contingency plan if one of the new recruitment estimates (2020–2022) was anomalously high to which Dr. Terceiro indicated that early signs suggest there is a low risk of this happening, but if it should, he is likely to explore an alternate projection run with the anomalous recruitment(s) removed. The AOP also discussed whether exploration of revisions to historical selectivity blocks would elevate the assessment to Level 3, but the AOP felt comfortable that should time allow for this exploration, given the other modest changes proposed for this assessment, there would be adequate review time under a Level 2 review; moreover, it appears as though past practice has been to maintain Level 2 assessments for this type of proposed change (e.g. scup).
The AOP supported a Level 2 assessment review for summer flounder. Justification for this recommendation included the notion that the time available for a Level 2 review is sufficient to address all proposed changes.
AOP Meeting Conclusions:
The AOP met on February 23, 2023 to review the stock assessment plans for 7 stocks scheduled for the June 2023 Management Track cycle. The panel concluded that a Level 1 review (Direct Delivery) was warranted for Atlantic mackerel; Level 2 reviews (Expedited Review) for bluefish, deep-sea red crab, longfin inshore squid, scup and summer flounder; and Level 3 review (Enhanced Review) for spinydogfish. The Level 2 and 3 reviews will occur during the June 2023 Management Track Peer Review scheduled for June 26–28, 2023. In the case of spiny dogfish, the NRCC decided to delay the review until the September Management Track peer review. Changes in the required review level would be triggered by a Northeast Fisheries Science Center request to increase the review level for a given stock. The AOP could concur to increase the review level via email or request to reconvene the AOP panel to have further discussions with the stock assessment lead. In the case of Atlantic mackerel, if the 2022 egg/biomass index is not available, the AOP agreed to raise the review level to Level 2 (Expedited Review) via correspondence. Any need to reconvene the panel would be a publicly announced meeting and any subsequent changes to the review level would be publicized to assessment partners and stakeholders.
Appendix A.1. Meeting participants
Panel, February 2023:
-
Michele Traver – NEFSC
Online Attendees and Presenters, February 2023:
-
Eric Reid – Fisheries Consultant
-
Greg DiDomenico – Lund’s Fisheries
-
James Boyle – University of Miami
-
Jeff Kaelin – Lund’s Fisheries
-
Katie Almeida – Town Dock
-
Meghan Lapp – Sea Freeze
-
Michael Waine – American Sportfishing Association
Appendix B. Management Track Stock Assessment Terms of Reference
- 1.
Estimate catch from all sources including landings and discards.
- 2.
Evaluate indices used in the assessment (e.g., indices of relative or absolute abundance, recruitment, state surveys, age-length data, etc.).
- 3.
Estimate annual fishing mortality, recruitment and stock biomass (both total and spawning stock) as possible (depending on the assessment method) for the time series using the approved assessment method and estimate their uncertainty. Include retrospective analyses if possible (both historical and within-model) to allow a comparison with previous assessment results and projections, and to examine model fit.
- a.
Include bridge runs to sequentially document each change from the previously accepted model to the updated model proposed for this peer review.
- b.
Prepare a backup assessment approach that would serve as an alternative for providing scientific advice to management if the analytical assessment were to not pass review.
- a.
- 4.
Re-estimate or update the BRP s as defined by the management track level and recommend stock status. Also, provide qualitative descriptions of stock status based on simple indicators/metrics (e.g., age- and size-structure, temporal trends in population size or recruitment indices, etc.).
- 5.
Conduct short-term stock projections when appropriate.
- 6.
Respond to any review panel comments or SSC concerns from the most recent prior research or management track assessment.
Note: Major changes from the previous stock assessment require pre-approval by the Assessment Oversight Panel.
Appendix C. June 2023 Management Track Peer Review meeting attendees.
Panel, June 2023:
-
Cynthia Jones – Chair
-
Alexei Sharov – Panel
-
John Wiedenmann – Panel
-
Katie Drew – Panel
NEFSC Leadership:
Online Attendees and Presenters:
-
Greg DiDomenico – Lund’s Fisheries
-
Kate Wilke – Nature Conservancy (Virginia)
-
Michael Waine – American Sportfishing Association
-
Will Poston – American Saltwater Guides Association
Appendix D. Realized Agenda for June 2023 Management Track peer review
| Time | Subject | Lead |
|---|---|---|
| Tuesday, June 26, 2023 | ||
| 9:30–9:45am | Welcome/Logistics/Conduct of Meeting | Michele Traver, Russ Brown, Cynthia Jones, Chair |
| 9:45–11:15am | Deep Sea Red Crab Discussion/Questions | Toni Chute, Panel |
| 11:15–11:30am | — Break — | |
| 11:30–12:00pm | Discussion/Summary | Panel |
| 12:00–12:15pm | Public Comment | Public |
| 12:15–1:15pm | — Lunch — | |
| 1:15–3:30pm | Scup Discussion/Questions | Mark Terceiro, Panel |
| 3:30–3:45pm | — Break — | |
| 3:45–4:15pm | Discussion/Summary | Panel |
| 4:15–4:30pm | Public Comment | Public |
| 4:30pm | — Adjourn — | |
| Wednesday, June 27, 2023 | ||
| 9:30–9:35am | Welcome/Logistics | Michele Traver, Cynthia Jones, Chair |
| 9:35–11:15am | Longfin inshore squid Discussion/Questions | Lisa Hendrickson, Panel |
| 11:15–11:30am | — Break — | |
| 11:30–12:00pm | Discussion/Summary | Review Panel |
| 12:00–12:15pm | Public Comment | Public |
| 12:15–1:15pm | — Lunch — | |
| 1:15–3:30pm | Summer flounder Discussion/Questions | Mark Terceiro, Panel |
| 3:30–3:45pm | — Break — | |
| 3:45–4:15pm | Discussion/Summary | Review Panel |
| 4:15–4:30pm | Public Comment | Public |
| 4:30pm | — Adjourn — | |
| Thursday, June 28, 2023 | ||
| 9:00–10:00am | Closed session | Panel |
| 10:00–12:00am | — No session — | |
| 12:00–1:00pm | — Lunch — | |
| 1:00–2:30pm | Bluefish, Discussion/Questions | Tony Wood, Panel |
| 2:30–2:45pm | — Break — | |
| 2:45–3:15pm | Discussion/Summary | Panel |
| 3:15–3:30pm | Public Comment | Public |
| 3:30–4:30pm | Report Writing | Review Panel |
| 4:30pm | — Adjourn — | |
2. ATLANTIC BLUEFISH
This assessment of the Atlantic Bluefish (Pomatomus saltatrix) stock is a management track update assessment of the existing 2022 research track assessment (NEFSC 2022). Stock status for bluefish from the research track assessment (data through 2021) found the stock was not overfished, and overfishing was not occurring. The current assessment updates commercial fishery catch data, recreational fishery catch data, research survey indices of abundance, and the analytical state-space WHAM assessment model and reference points through 2022. Additionally, stock projections have been updated through 2025.
State of Stock: Based on this updated assessment, the Atlantic Bluefish (Pomatomus saltatrix) stock is not overfished and overfishing is not occurring (Figures 1–2). Retrospective bias in model results was considered minor and retrospective adjustments were not necessary. Spawning stock biomass (SSB) in 2022 was estimated to be 52,747 (mt) which is 60% of the biomass target (SSBMSY proxy= 88,131 (mt); Figure 1). The 2022 fully selected fishing mortality was estimated to be 0.152 which is 64% of the overfishing threshold (FMSY proxy= 0.239; Figure 2).
Table 3: Catch and status table for Atlantic Bluefish. All weights are in mt, recruitment is in 000s and FFull is the fishing mortality on fully selected ages (age-2). Model results are from the current updated WHAM assessment.
| 2013 | 2014 | 2015 | 2016 | 2017 | 2018 | 2019 | 2020 | 2021 | 2022 | |
|---|---|---|---|---|---|---|---|---|---|---|
| Data | ||||||||||
| Recreational landings | 15,732 | 12,324 | 13,725 | 10,634 | 15,620 | 5,857 | 6,800 | 5,923 | 5,471 | 5,002 |
| Recreational discards | 2,472 | 2,880 | 3,690 | 1,838 | 1,794 | 1,578 | 1,702 | 1,253 | 1,391 | 1,400 |
| Commercial landings | 1,977 | 2,251 | 1,917 | 1,946 | 1,876 | 1,105 | 1,359 | 1,112 | 1,090 | 1,025 |
| Commercial discards | 12 | 18 | 14 | 14 | 7 | 8 | 10 | 7 | 12 | 9 |
| Catch for Assessment | 20,194 | 17,473 | 19,345 | 14,431 | 19,297 | 8,548 | 9,871 | 8,294 | 7,963 | 7,436 |
| Model Results | ||||||||||
| Spawning Stock Biomass | 67,325 | 53,698 | 46,283 | 43,981 | 41,153 | 35,152 | 41,702 | 42,811 | 44,979 | 52,747 |
| FFull | 0.34 | 0.353 | 0.438 | 0.345 | 0.495 | 0.232 | 0.231 | 0.196 | 0.19 | 0.152 |
| Recruits (age-0) | 136,314 | 120,570 | 101,743 | 69,713 | 112,997 | 111,734 | 68,541 | 74,543 | 97,120 | 137,139 |
Projections: Short-term projections were conducted in WHAM, and incorporate model uncertainty, auto-regressive processes and uncertainty in recruitment and numbers-at-age. Removals in 2023 were assumed to be equal to the 2023 ABC (13,890 mt), and projections were carried forward for years 2024–2025 at FRebuild = 0.183. The MAFMC council risk policy (CV= 100%) was used to develop ABC values in each year, and the projection was re-iterated using these values as annual removals in place of FRebuild. Projected ABC catch in 2024 and 2025 based on this approach is 7,929 mt and 9,903 mt, respectively.
The projection uses 5-year averages for natural mortality, maturity, fishery selectivity and weightsat-age. The 5-year average was selected for those parameters to capture the most recent conditions while still smoothing some interannual variability. Projections were not retrospectively adjusted, as the adjusted terminal year estimates of F and SSB fell within the 90% confidence intervals of the unadjusted values.
Table 4: Comparison of reference points estimated in the 2022 research track assessment and from the current assessment update. An F35% proxy was used for the overfishing threshold and was based on SPR calculations. The SSBMSY proxy is calculated using the value of F35%SPR and mean recruitment.
| 2022 | 2023 | |
|---|---|---|
| FMSY proxy | 0.249 | 0.239 (0.199–0.287) |
| SSBMSY (mt) | 91,987 | 88,131 (65,576–118,445) |
| MSY (mt) | 19,618 | 18,979 (14,025–25,684) |
| Median recruits (age-0) (000s) | 103,133 | 108,035 |
| Overfishing | No | No |
| Overfished | No | No |
Table 5: Short term projections of total fishery catch and spawning stock biomass for Atlantic Bluefish based on a harvest scenario assuming annual ABC values calculated from FRebuild (0.183) and the MAFMC risk policy between 2024 and 2025. Catch in 2023 was assumed to be the previously established ABC value of 13,890 (mt).
| Year | Catch (mt) | SSB (mt) | FFull |
|---|---|---|---|
| 2023 | 13,890 | 59,135 (39,120–89,391) | 0.239 |
| Year | Catch (mt) | SSB (mt) | FFull |
| 2024 | 7929 | 66,706 (41,439–107,379) | 0.121 |
| 2025 | 9903 | 75,757 (43,303–132,534) | 0.137 |
Special Comments:
- •
What are the most important sources of uncertainty in this stock assessment? Explain, and describe qualitatively how they affect the assessment results (such as estimates of biomass, F, recruitment, and population projections).
Some of the important sources of uncertainty relate to assessment data inputs and the availability of information that would help better understand the dynamics of bluefish. Research recommendations from the recent research track assessment fully detail these uncertainties and data needs. A list of some of the research ideas designed to improve the bluefish stock assessment and reduce some of the uncertainties include:
- 1.
Expanding the collection of recreational release length frequency data. The bluefish assessment stratifies recreational release lengths by region, and data in the southern region is lacking. These southern fish tend to be smaller and improved information pertaining to the size distribution of the southern fish would help refine the estimate of recreational discard weight.
- 2.
Addressing the uncertainty around temporal availability of bluefish to the fisheries and surveys. The research track assessment made significant advancements in developing an index of bluefish availability based on forage fish in the diets of bluefish like predators. This forage fish index was incorporated into a companion assessment model as a covariate on MRIP CPUE catchability. Further developing this index will help improve the assessment model fit to the MRIP CPUE information, which is an important index that helps scale biomass estimates from the model.
- 3.
Develop fishery dependent or independent sampling programs to provide information on larger, older bluefish. The dynamics of this size class are not well sampled or understood.
- 4.
Develop an updated recreational release mortality study to derive a more informed estimate of recreational discard mortality. Recreational discards are a significant proportion of the total catch so reducing the uncertainty around the release mortality is important.
- 1.
- •
Does this assessment model have a retrospective pattern? If so, is the pattern minor, or major? (A major retrospective pattern occurs when the adjusted SSB or FFull lies outside of the approximate joint confidence region for SSB and FFull).
The 7-year Mohn’s ρ, relative to SSB, was 0.14 in the 2022 assessment and was 0.22 in this assessment. The 7-year Mohn’s ρ, relative to F, was 0.10 in the 2022 assessment and was 0.14 in this assessment. This is considered a minor retrospective pattern for both SSB and F because the ρ-adjusted estimates of 2022 SSB (SSBρ= 43,235) and 2022 F (Fρ= 0.177) were within the approximate 90% confidence regions around SSB (36,194–76,871) and F (0.105–0.219).
- •
Based on this stock assessment, are population projections well determined or uncertain? If this stock is in a rebuilding plan, how do the projections compare to the rebuilding schedule?
Population projections for Atlantic Bluefish are reasonably well determined. Shifting to WHAM for model projections has allowed for the incorporation of model uncertainty, auto-regressive processes, and the uncertainty in recruitment and numbers-at-age. The retrospective pattern in F and SSB is considered minor (within the 90% CI of both F and SSB), however, the ρ values of F and SSB have increased when compared to the previous research track assessment.
The Atlantic Bluefish stock is in a rebuilding plan with a rebuild date of 2028. FRebuild was re-calculated using a projection that assumes a constant F strategy, such that biomass in 2028 has a 50% chance of exceeding the SSBMSY proxy; FRebuild was calculated to be 0.183. The MAFMC risk policy was applied using this FRebuild strategy in short term projections to generate ABC values that are consistent with the rebuilding schedule for the next two years.
- •
Describe any changes that were made to the current stock assessment, beyond incorporating additional years of data and the effect these changes had on the assessment and stock status.
A change to the way the age-length keys (ALK) were developed from the research track, which used full multinomial age-length keys, was implemented for this Atlantic Bluefish assessment update. Instead of using full multinomial age-length keys, a hybrid approach was used, and the holes in the ALK were filled with the multinomial model fits. This approach to filling ALK holes isnow consistent with the methodology used for other NEFSC stock assessments and with the NEFSC StockEff program. This new method resulted in minor changes to the results of SSB and F compared to the 2022 research track assessment results.
- •
If the stock status has changed a lot since the previous assessment, explain why this occurred.
Stock status of Atlantic Bluefish has not changed from the status determined in the research track assessment.
- •
Provide qualitative statements describing the condition of the stock that relate to stock status.
The Atlantic Bluefish stock has experienced a slight increase in SSB over the past 5 years, coinciding with a decrease in F. Recruitment has increased each year since 2019, and the terminal year recruitment (137 million fish) is the highest value since 2005. Both commercial and recreational fisheries have had low catches since 2018, all well below the time series average of 26,386 mt. With the low catches since 2018, fishing mortality has decreased and remained well below FMSY proxy (0.239). The low catches in recent years are partially a result of bag limit implementation as part of the rebuilding plan. However, these lower catches could also be due to decreased bluefish availability. Anecdotal evidence suggests larger bluefish stayed offshore and inaccessible to most of the recreational fishery in recent years.
- •
Indicate what data or studies are currently lacking and which would be needed most to improve this stock assessment in the future.
The recent bluefish research track identified several new research recommendations that would improve our understanding of bluefish dynamics and help better assess the population through the current or future models. These recommendations include: expand collection of recreational release length frequency data, continue development and refinement of the forage fish / availability index as well as incorporation of this index into a base model for bluefish management advice, initiate additional fisheries-independent surveys or fishery-dependent sampling programs to provide information on larger, older bluefish, continue coastwide collection of length and age samples from fishery-independent and -dependent sources, refinement and development of indices of abundance, and develop a recreational demand model.
- •
Are there other important issues?
WHAM allows for incorporation of environmental covariates on the catchability of survey indices, and a companion model was developed for the research track that leveraged this capability. The companion model investigated a forage fish index as a covariate on catchability of the MRIP CPUE and showed promise for continued development. The covariate led to an overall decreasing trend in catchability over time. This model will be further developed leading up to the 2025 management track assessment, at which time it could be considered for the primary model.
2.1. Reviewer Comments: Atlantic Bluefish
A Research Track Assessment (RTA) was recently completed for Atlantic bluefish (Pomatomus saltatrix) in 2022. Bluefish had previously been assessed using NOAA ToolBox Age-Structured Assessment Program (ASAP). The RTA accepted the WHAM model, a state-space model, for use in bluefish assessments. The 2023 update used WHAM and included one year of data (2022). Commercial and recreational landings have declined through the time series. Recreational landings of 5,002 mt are below the series average of 19,625 mt and are a series low. Total catch in 2022 was 7,436 mt, a series low. Eighty-six percent of the catch are from the recreational fishery.
The model also included new indices: an MRIP CPUE index based on a guild approach which considered a bluefish trip either when bluefish or a species associated with bluefish was caught, SEAMAP age-1, and the calibrated CHESMAP Trawl Survey. Other new input data include recreational discards by season and region, the use of multinomial age-length keys to fill in missing values and 2 selectivity blocks for Commercial landings and 3 for Recreational. An improvement to the analysis is the use of lengths and weights of southern bluefish to estimate discard weights. There was concern that using lengths and weights from only northern fish would overestimate discards but also because the model fits both landings and discards. These modifications resulted in significant changes in natural mortality (M is now agespecific) and reduced the target SSB by 50%. The model retrospective SSB and F fell within the 95% confidence bands and were not adjusted.
The Management Track Assessment (MTA) in 2021 which used the ASAP model and determined that bluefish was overfished and overfishing was not occurring. The 2023 data update estimated a total bluefish population of 217 million, a moderate increase. Recruitment is estimated at 137 million, above the average and highest since 2005. The 2022 SSB is estimated to be 52,747 mt, above the SSBThreshold of 44,066 mt and below the 2022 SSBTarget of 88,131 mt. The F35%% reference point was 0.239. In the 2021 ASAP assessment the SSBTarget was greater than twice the SSBTarget in the RT 2022 WHAM model with the resulting SSBThreshold in 2022 half that from the previous assessment. Those results in 2021 were twice the values from the previous assessment (SAW 60) (NEFSC 2021) and believed to be the result of the MRIP calibration that scaled up recreational catch. The change in reference points presented in the MTA 2023 are believed to be the result of the use of WHAM that has less reliance on MRIP, uses a guild CPUE and inclusion of different indices used. The modeling also used a decreased discard mortality rate (15%–9.4%), discard lengths by season and region, and Lorenzen WAA to produce age-specific natural mortality. The MTA 2023 update resulted in evaluation that Atlantic bluefish was not overfished and overfishing was not occurring. The recent fishing mortalities were among the lowest in the series, as was the catch in both the commercial and recreational fisheries.
Short-term projections were done in WHAM using Removals were assumed to be 13,890 mt, the 2023 ABC and were projected with the FRebuild (0.183) under the MAFMC 100% risk policy. The projected SSB increased from 59,135 mt in 2023 to 75,757 mt in 2025.
The Panel concluded that the TORs had been met. The Panel discussed the value of the WHAM model to further explore environmental variables that might be driving availability of bluefish. Of particular interest is the episodic spatial distribution of large bluefish. Their presence inshore and availability to the fishery is inconsistent with attributed numbers and the drivers of this availability uncertain. Another concern of the Panel was the estimate of higher recruitment given that it is among the highest in recentyears. It falls within the confidence intervals but the model evidenced a tendency to overestimate R.
The Panel had some research recommendations: Obtaining better data on recreational discard lengths would be valuable. This endeavor relies on volunteer angler reporting such as was done previously in South Carolina. NMFS should consider developing an app that can be used by anglers to report discard lengths. Because self-reporting can introduce bias, the statistical issues should also be explored. The Panel also commented that the M was high on young fish and evaluating the underlying causes might be a valuable project for funding.
The Panel concluded that the 2022 assessment update for Atlantic bluefish fulfilled the recommendations of the AOP, is technically sufficient to provide scientific advice and meets the Terms of Reference for the stock’s assessment.
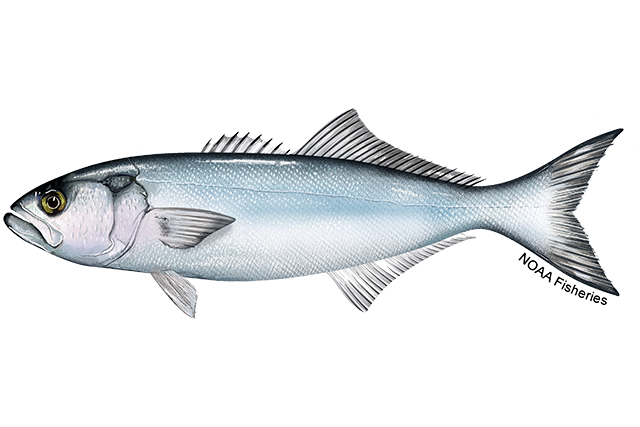
•Pomatomus saltatrix, Bluefish.
References:
Northeast Fisheries Science Center. 2022. 2022 Bluefish Research Track Assessment NOAA Fisheries, Northeast Fish Sci Cent Ref Doc. XXX; 116p.https://apps-nefsc.fisheries.noaa.gov/saw/sasi.php
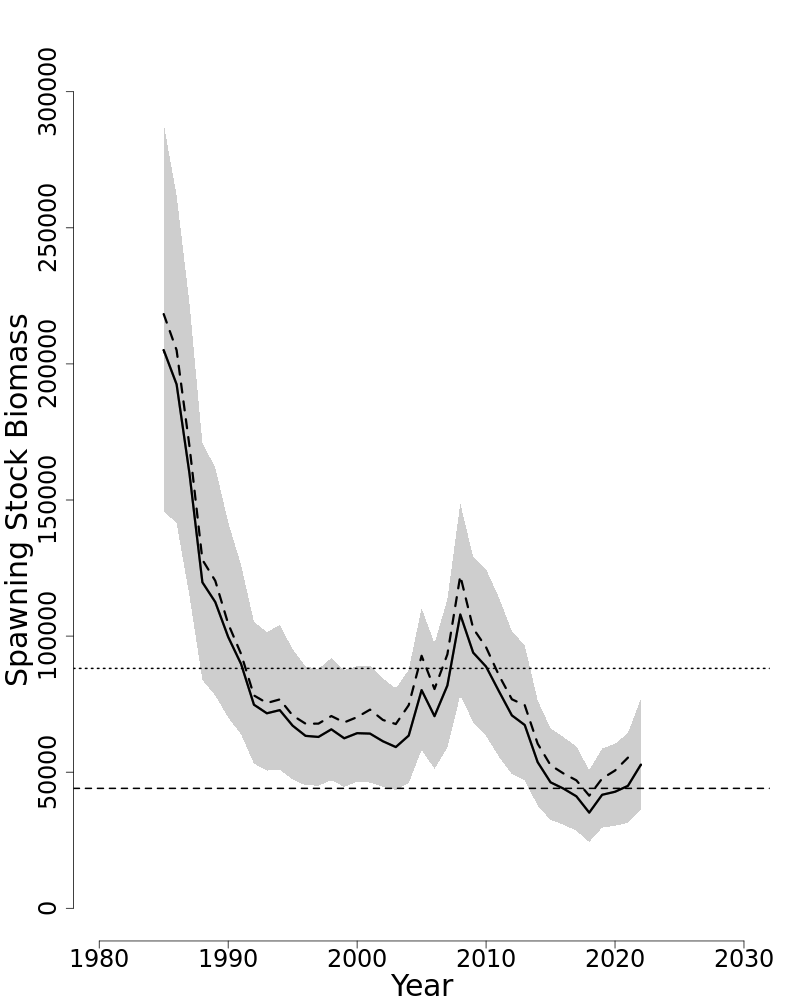
Figure 1: Trends in spawning stock biomass of Atlantic Bluefish between 1985 and 2022 from the current (solid line) and previous (dashed line) research track assessment and the corresponding SSBThreshold (1/2 SSBMSY proxy; horizontal dashed line) as well as SSBTarget (SSBMSY proxy; horizontal dotted line) based on the 2023 assessment. The approximate 90% log-normal confidence intervals are shown.
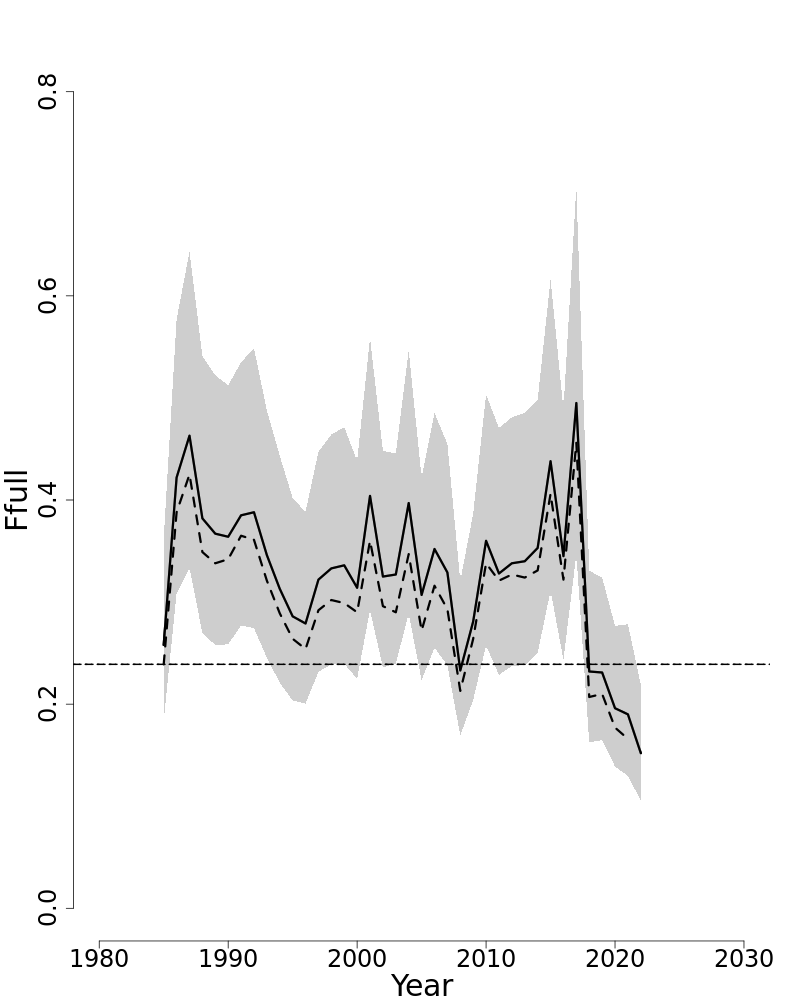
Figure 2: Trends in the fully selected fishing mortality (FFull) of Atlantic Bluefish between 1985 and 2022 from the current (solid line) and previous (dashed line) research track assessment and the corresponding FThreshold (FMSY proxy=0.239; horizontal dashed line). The approximate 90% log-normal confidence intervals are shown.
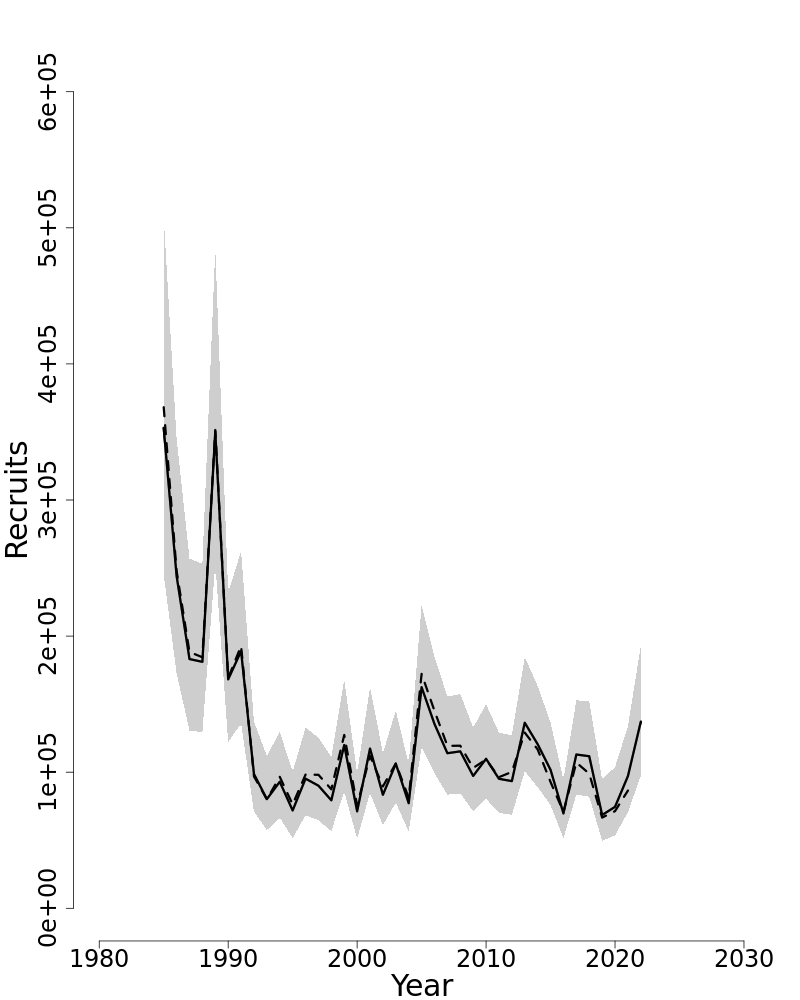
Figure 3: Trends in Recruits (age-0) (000s) of Atlantic Bluefish between 1985 and 2022 from the current (solid line) and previous (dashed line) research track assessment. The approximate 90% log-normal confidence intervals are shown.
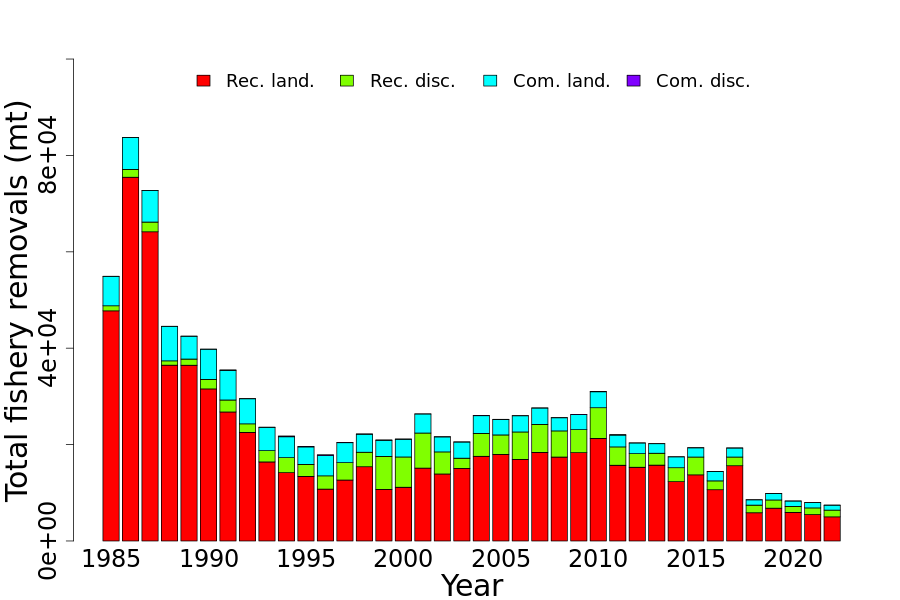
Figure 4: Total catch of Atlantic Bluefish between 1985 and 2022 by fleet (Recreational and Commercial) and disposition (landings and discards).
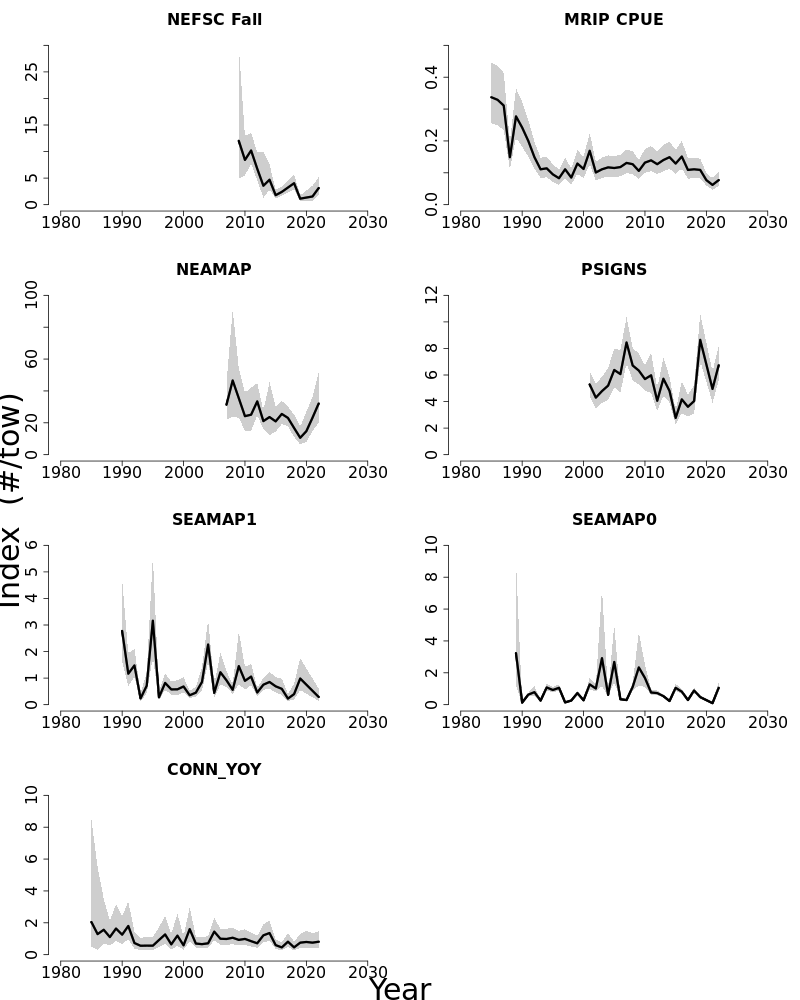
Figure 5: Atlantic Bluefish indices of abundance for the most important regional and state surveys. The approximate 90% log-normal confidence intervals are shown.
3. DEEP SEA RED CRAB
A data update for deep-sea red crab (Chaceon quinquedens) occurs every four years during the specifications-setting process. The last data update occurred in 2019 when the specifications for fishing years 2020–2023 were set. The data updates do not result in a determination of the stock status as there are no biological reference points for red crab. Commercial fleet landings, incidental landings, estimated fleet LPUE, and port sampled length frequencies are compiled for this update. Data from observed red crab trips are also updated.
Table 6: Catch table for deep-sea red crab. All weights are in mt.
| 2010 | 2011 | 2012 | 2013 | 2014 | 2015 | 2016 | 2017 | 2018 | 2019 | 2020 | 2021 | 2022 | |
|---|---|---|---|---|---|---|---|---|---|---|---|---|---|
| Data: landings | |||||||||||||
| Commercial fleet | 1,412 | 1,625 | 1,180 | 928 | 985 | 1,613 | 1,387 | 1,366 | 1,631 | 1,670 | 1,952 | 1,559 | 2,067 |
| Incidental | 2 | 1 | 0 | 0 | 0 | 0 | 1 | 0 | 2 | 1 | 4 | 3 | 5 |
Table 7: Estimated reference points for deep sea red crab
| 2019 | 2023 | |
|---|---|---|
| Overfishing | Unknown | Unknown |
| Overfished | Unknown | Unknown |
Special Comments:
- •
What are the most important sources of uncertainty in red crab data?
Estimates of LPUE are made in two ways: per trap hauled, and per day fished. The two estimates generally track each other well. In the case of per day fished, steam time is not considered which increases uncertainty. In the case of traps hauled, the number of traps per string noted in the VTR trip entry is not always the number of traps emptied per haul due to a number of causes normal for fishing, which increases uncertainty.
Especially in a potentially food-limited environment, there also may be uncertainty in calculating LPUE in a baited trap fishery. If the pot is left to soak long enough, it can attract enough crabs to fill the pot and appear as if the population has not changed in density over time. The crabs must travel longer distances to reach the bait.
There is very little uncertainly in landings due to the specialized fleet and processing needs.
- •
Does this assessment model have a retrospective pattern? If so, is the pattern minor, or major?
- •
Based on this stock assessment, are population projections well determined or uncertain? If this stock is in a rebuilding plan, how do the projections compare to the rebuilding schedule?
- •
Describe any changes that were made to the current stock assessment, beyond incorporating additional years of data and the effect these changes had on the assessment and stock status.
- •
If the stock status has changed a lot since the previous assessment, explain why this occurred.
- •
Provide qualitative statements describing the condition of the stock that relate to stock status.
- •
Indicate what data or studies are currently lacking and which would be needed most to improve this stock assessment in the future.
After implementation of the FMP in 2002, the red crab fishery was restricted to five full-access permits. The vessels fish cooperatively and over a wide area. The footprint of the fishery stretches from the Hague line to Virginia. The fishery is, by regulation, male-only. Landings include some females landed under an EFP during the years 2010 and 2011 but this did not continue. Red crabs are known to segregate loosely by sex and perhaps even size, with the smallest individuals being found further down the continental slope in deeper water. This is one aspect of the fishery that makes discarding highly variable, as the fishing vessels find areas where there is a high concentration of large males but there are always a certain number of females and undersized males which are discarded depending on where the pots are set.
Red crab is considered a data-poor species. They live outside the range of NEFSC surveys (they are sometimes caught in the northern shrimp survey and non-random deep stations in the bottom trawl survey, but in very small numbers) so there is no fishery-independent index of abundance.
Almost nothing is known about deep-sea red crab growth and longevity, and methods of crustacean ageing are still in development and highly uncertain. There have been some studies on mating behavior of captive red crabs, but they do not live long in captivity so controlled growth studies have not been possible. A tagging study for growth was attempted in 2010 with poor results. Very few tagged crabs were ever recovered, for reasons unknown.
There have been two surveys of the deep-sea red crab resource in the past; one in 1974 (Wigley, Theroux and Murray, 1975) and another during the summers of 2003–2005 (Wahle et al. 2008). The first survey was undertaken soon after the fishery began and the second shortly after the deep-sea red crab FMP was implemented in 2002. The methods used by the two surveys were the same, and the 2003–2005 survey attempted to replicate the survey gear used in 1974 as closely as possible. At some stations a benthic sled equipped with a camera and strobe light was towed along the bottom for 30–75 minutes, taking a picture every 10 seconds. The area of bottom illuminated in the images was estimated, and counting the red crabs visible in each image, then extrapolating thatnumber out to the area of the survey resulted in an estimate of swept-area abundance. At other stations, a trawl net was deployed to determine red crab sex ratios, weights and length frequencies by sex. Mean weights were used to estimate swept-area biomass.
After the second survey, it was possible to see the effect the fishery had on red crab population structure. As would be expected, the number of large male crabs was reduced. However, the number of smaller males and females appeared to have increased. After the results of the second survey were presented at the Northeast Data Poor Stocks Working Group in 2008 (citation below), the potential for sperm limitation in the red crab population caused concern. It was noted in the mating studies and seen in the benthic sled images that male red crabs needed to be about 50% larger than the females to be able to mate, since the male carries the female underneath his body during the process. If the larger males were being removed from the population, there was concern that the largest females with the highest repoductive potential would not be able to find mates and recruitment would diminish.
There have been efforts to estimate MSY for red crab, most recently also at the Northeast Data Poor Working Group meeting. The group tried several models and methods at the time, and reviewed estimates that had taken place in the past. Specifically the models were the depletion-corrected average catch (DCAC) model and the two-point boundary model. The DCAC model works from the idea that for a new fishery, in calculating average catch for an estimate of sustainable yield, the windfall at the start of a fishery will represent a certain number of units of sustainable yield and increase beyond the actual number of years of fishing, with that increase being based on an estimate of natural mortality. The two-point boundary model estimates the average recruitment needed to sustain the catch time series based on mature biomass at two points in time defined as the initial and final survey values, then estimates equilibrium catch based on recruitment, final biomass and survival. At the end of the day there was not one widely accepted value due to many factors, and the group determined there was substantial uncertainty in any potential BRP estimates that came out of the workshop based on current information about the stock. Survey-based BRPs were also relying on assumptions that the population was stationary and the fishing area did not extend beyond the surveyed area.
In terms of other effects of the fishery on the population, the percent mortality for discarded crabs is unknown. Crabs apparently survive being brought to the surface and returned to the bottom still contained in a special crab hotel at a high percentage, but method of discard (dropping vs. sliding) can increase mortality (Tallack 2007). Little is known about the survival of crabs discarded from a vessel that must descend down through hundreds of meters of water without protection after handling.
Since the FMP was put in place, the information originally available to assess the sustainability of the fishery has been total landings and port sampled carapace widths from which estimates of LPUE could be made and the size of landed crabs could be monitored. Estimates of LPUE used as a proxy for abundance can be uncertain in a pot fishery (see above). There are also economic and/or market factors that may affect culling patterns, fishing effort, location and catch for red crab. The fishery is market-driven and annual variations in landings reflect this.
In recent years (2016+) observer coverage of the red crab fishery has increased substantially and the data observed trips provide have allowed us to look at other aspects of red crab biology and thefishery. Since we never had information about undersized males that were discarded at sea, their numbers and length frequencies recorded by observers give us some information about recruitment. Since we never had information about females as they were all discarded at sea, their length frequencies and reproductive status (egg) data recorded by observers give us some information about the potential for sperm limitation. Most of the egg observations have been presence/absence but there have been some observers who stage the eggs, which determines if they are viable; important to note on the larger females especially where sperm limitation is a concern. The measurements of females, which have not had the same level of fishery removals as the males, have provided evidence that the crabs caught at the southern end of the fishery footprint reach greater maximum sizes than those caught in the more northern regions. Anecdotally, the red crabs found in the Gulf of Maine are the smallest, so there is likely a latitudinal size gradient.
Based on this information and previous recommendations, questions for research are listed below. They include the recommendations from the 2008 Northeast Data-poor Stocks Working Group report, past assessments, Tallack (2007) and Wahle et al. (2008).
- –
What is the lifespan of a red crab?
- –
How often do red crabs molt, and what is the percent increase in body size after a molt? Do red crabs, especially females, have a terminal molt? Molt frequency of females would be especially important too, as they mate during the molt period.
- –
Do red crabs store sperm and if so for how long? Although some crabs are known to store sperm from a single mating to produce several clutches of eggs, it is unclear whether red crabs have this ability.
- –
What percent of females with eggs are carrying viable eggs? Unmated females may produce clutches of unfertilized eggs.
- –
How long do red crabs incubate their eggs? This would be useful to know in conjunction with molt frequency and sperm storage capability as it could relate to how many clutches of eggs a female could have in an intermolt period.
- –
How many eggs are carried in a clutch and how does this vary by the size of the crab? Are there patterns that might indicate sperm storage?
- –
Can we gather additional information on the relative sizes of mating pairs and any possible effects on reproductive potential? Could simulation modeling be used to explore the response of population sex ratios and size ratios to different fishing patterns? Is there a way to evaluate the importance of large male red crabs in reproduction considering the size distribution of females?
- –
How can we design a successful tagging study to explore red crab growth rates, fishing mortality rates and molt frequencies in situ?
- –
Are there any new, innovative ageing methods that might work for red crab?
- –
What is the main food source for red crabs? Are they cannibalistic?
- –
How much and when do red crabs move about their range? Is there a seasonal migration of one or both sexes?
- –
Can we improve estimates of total discard mortality by considering seasonality, predation and displacement?
- –
Could gear design studies help reduce discard and increase efficiency in the red crab fishery?
- –
- –
Traditional reference points for the deep-sea red crab stock are difficult to estimate due to lack of basic information. Are there non-traditional reference points that could be used to determine stock status? Could BRP s based on size and sex ratios be useful due to the importance of preventing sperm limitation? It would require regular surveying.
- –
How do economic factors alter the distribution and interpretation of fishing effort for the red crab fishery?
- –
Can we collect biological data from a large number of red crabs over a wide area, crabs that have not been selected by a commercial trap (say, with a trawl) and are therefore more representative of the population at large? What questions could that help us answer: percentage of females with eggs, sperm storage, percentage in different shell conditions and states of molting, degree of segregation of the population by sex and size?
- –
Would regular surveys of the red crab population provide useful information on the continuing effects of the fishery and the current population structure? What methods could be used? Can we get a better understanding of the habitat–abundance relationship for allocation of effort for any potential survey?
- –
- •
Are there other important issues?
None.
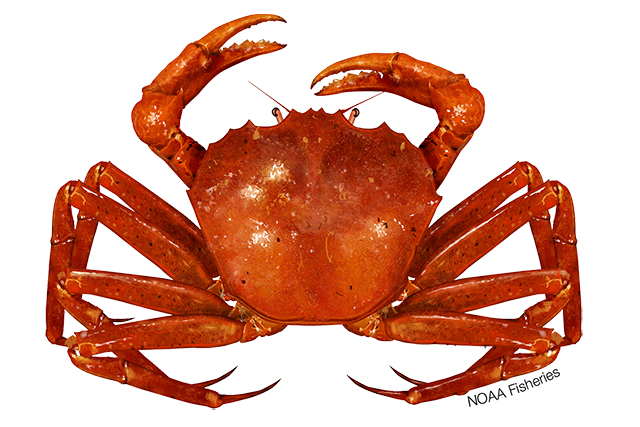
•Chaceon quinquedens, Atlantic Deep Sea Red Crab.
3.1. Reviewer Comments: Deep sea red crab
Deep-sea red crab (Chaceon quinquedens) is a data-poor species with little known of its growth or longevity. They are found in areas outside the NEFSC surveys and so there is no fishery-independent estimate of abundance. A tagging study was attempted in 2010 but tag returns were very low and insufficient to derive any information about the species. The fishery is small with only 5 license holders and by regulation is a male-only fishery. Data input included the calculation of LPUE based on 3 methods: 1) per trap, 2) per day, and 3) per day with constant steam time.
Management advice for deep-sea red crab is based on DCAC, the depletion-corrected average catch model used for data poor stocks, and historical landings.The best estimate of MSY was based on 2 surveys conducted in 1974 and 2003–2005. The second survey showed a depletion of large males, potentially impacting mating success. The 2023 Management Tract Assessment (MTA) updates the last 2019 data update. This 2023 data update includes all information through 2022 including: landings, LPUE, carapace length of landed males, and observer data of length of kept and discard crabs and egg status of females.
An MSY estimated from the DCAC ranged from 1785–1862 mt and the 2-point boundary model estimated 1987–2044 mt. The range of 1700–1900 is now being used as the best estimate of MSY. Natural mortality used for MSY estimates are between 0.05–0.15.
The Peer Review Panel (Panel) discussed the importance of evaluating the time series of size-frequencies quantitatively to see patterns for landed males but also to evaluate discard lengths of smaller males and females for any patterns. We are aware that high grading may add some bias to results. They also discussed the availability of other modeling approaches to improve data input, such as the use of GLMs. The Panel also felt that the observer data was a valuable source of information for estimating female reproductive productivity.
Research suggestion: The assessment report included a number of research recommendations, all of which the Panel agreed would be useful information to obtain. However, the Panel prioritized the collection of growth and natural mortality information, the refinement of the LPUE index, and simulation modeling to develop reference points appropriate for this species’ life history as the most important areas of research to move the assessment to a more analytical approach. The Panel emphasized the importance of obtaining basic information of growth and, if possible, age. The Panel suggests that use of a GLM might be a better way to develop the LPUE indices that improve information on stock status. The Panel suggests that one way to improve the consistency of VTR reporting going forward would be to contact the license holders to address how they fill out these reports because there are only 5 of them. This would also help improve the LPUE calculations. Additionally, the Panel suggested the potential value of a boundary model simulation, a quasi-Bayes approach, and the fisheries behavior of similar species. Finally, the Panel emphasizes the importance of undertaking recommendations made since 2008 because deep-sea red crab is a valuable food resource.
The Panel concluded that the 2023 assessment update for deep-sea red crab fulfilled the recommendations of the AOP, is the Best Scientific Information Available evaluate stock status and meets the Terms of Reference for the stock’s assessment (TORs 3–5 were not evaluated because this is a data poor stock).
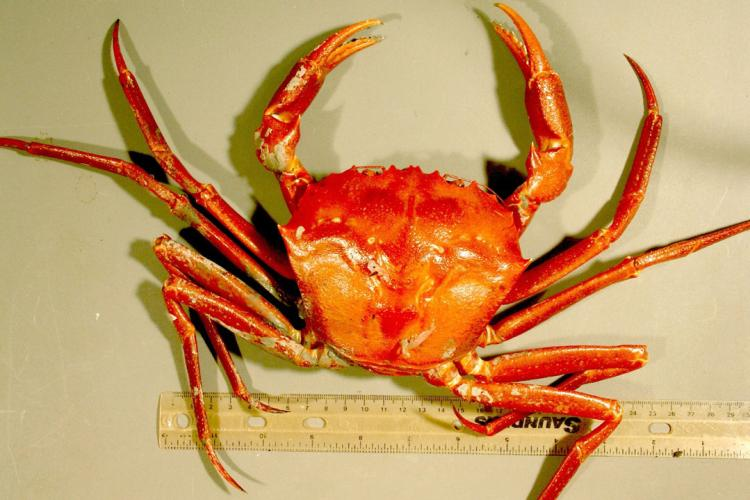
•Measuring the size of a deep-sea red crab.
References:
Wigley, Roland L., Roger B. Theroux and Harriett E. Murray, 1975. Deep-sea red crab, Geryon quinquedens, survey off northeastern United States. Marine Fisheries Review 37:8, 1–21. 1975MFRev:3781
Wahle, Richard A., Charlene E. Bergeron, Antonie S. Chute, Larry D. Jacobson, and Yong Chen, 2008. The Northwest Atlantic deep-sea red crab (Chaceon quinquedens) before and after the onset of harvesting. ICES J Mar Sci. 65: 862–872.JMS:fsn058
Tallack S.M.L, 2007. Escape ring selectivity, bycatch and discard survivability in the New England fishery for deep-water red crab, (Chaceon quinquedens). ICES J Mar Sci. 64: 1579–1586.JMS:fsm107
The Northeast Data Poor Stocks Working Group Report, December 8–12, 2008 meeting. Part A. Skate species complex, Deep sea red crab, Atlantic wolffish, Scup and Black sea bass. US Dept Commer, Northeast Fish Sci Cent Ref Doc. 09-02; 496p.CRD09-02
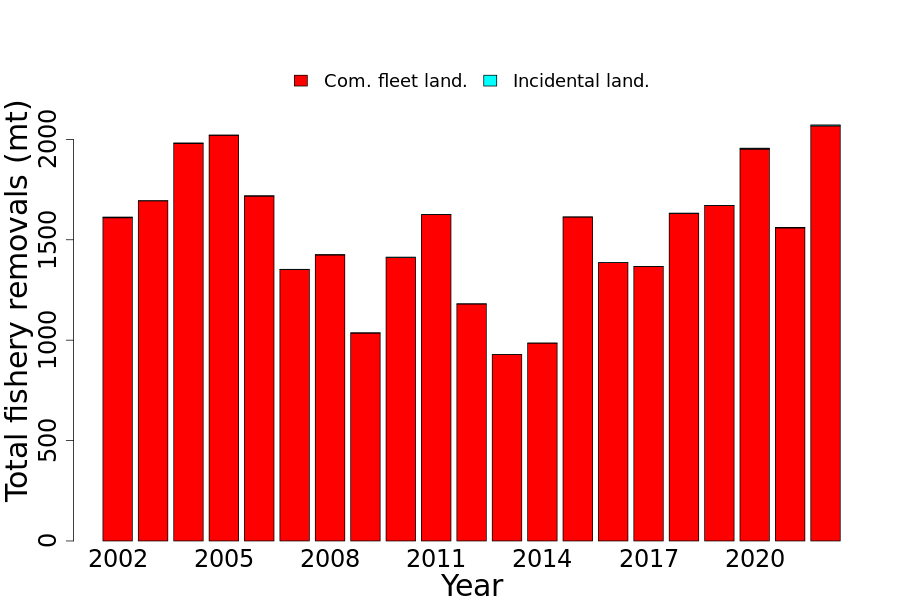
Figure 6: Total annual (calendar year) landings of deep-sea red crab since the FMP was implemented and the fleet was limited to five permits. Incidental landings are so small they are not visible in this plot.
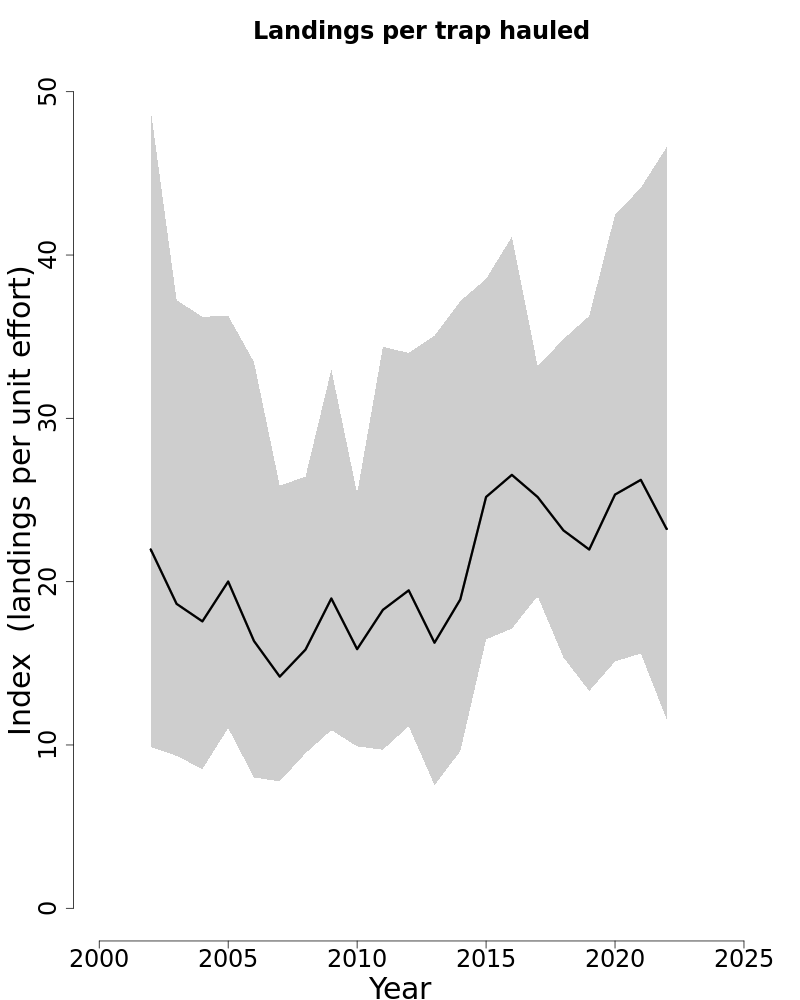
4. LONGFIN INSHORE SQUID
This Level 2 Management Track Assessment of longfin inshore squid (Doryteuthis (Amerigo) pealeii) is an update of the 2020 Level 3 peer-reviewed Management Track Assessment. The methodologies used to conduct the 2010 benchmark assessment during SARC 51 (NEFSC, 2011a; NEFSC, 2011b) were used in this assessment as well as the 2017 and 2020 assessment updates. Based on the 2020 assessment results the stock was not overfished and overfishing was unknown during 2019 (NEFSC, 2020). This assessment provides updates of commercial fishery catches (Table 8, Figure 10), q-adjusted, sweptarea biomass estimates, and exploitation indices (catch/biomass) through 2022 (Figure 11). Cohortspecific biomass was estimated separately for the NEFSC spring surveys versus NEFSC fall + NEAMAP fall surveys. Annualized biomass estimates, recommended by the SARC 51 Working Group as annually averaged spring and fall survey biomass estimates, were also updated. Cohort-specific exploitation indices (Jan.–June catch / spring survey biomass versus July–December catch / fall survey biomass) and annualized exploitation indices (annual catch / annually averaged spring and fall survey biomass) were updated as well.
State of Stock: Based on this updated assessment, the annualized stock status for longfin inshore squid (Doryteuthis (Amerigo) pealeii) is not overfished and overfishing is unknown. The annualized catchability-adjusted, swept-area biomass in 2022 (defined as the two-year moving average of the 2022 and 2021 annually averaged NEFSC spring and fall survey biomasses) was estimated to be 121,836 mt (80%CI= 106,748–136,923) (Figure 8), which was more than five times greater than the threshold BMSY proxy of 21,203 mt. Overfishing status could not be determined because there are no approved fishing mortality Reference Points for the stock. The 2022 annualized exploitation index (2022 catch divided by 121,836 mt) was estimated to be 0.155 (Figure 9), which was 20.1% less than the 1987–2021 median of 0.195. However, as recommended by the 2020 assessment review panel, cohort-specific biomass and biomass Reference Points should be used to determine stock status. The recommended stock status for the cohorts caught in both the spring and fall NEFSC surveys is not overfished and overfishing is unknown. The catchability-adjusted, swept-area biomass in 2022 was estimated to be 46,336 mt (80% CI= 42,545–50,128) (Figure 10) for the spring survey cohort and 197,335mt (80%CI= 167,403–227,268) (Figure 10) for the fall survey cohort, both of which were well above the threshold BMSY proxy of 11,152 mt for the spring survey cohort and 56,268 mt for the fall survey cohort.
Table 8: Catch and biomass assessment results for longfin inshore squid. All weights are in mt. DWF landings are the landings from the Distant Water Fleets. Total biomass estimates in this table were not used for stock status determination because they are the two-year moving averages of the annualized q-adjusted, swept-area biomass estimates for the NEFSC spring and fall bottom trawl surveys (i.e., averages of the two surveys). Exploitation indices represent the catch in year y divided by the two-year moving average of the annualized biomass estimate in year y.
| 2012 | 2013 | 2014 | 2015 | 2016 | 2017 | 2018 | 2019 | 2020 | 2021 | 2022 | |
|---|---|---|---|---|---|---|---|---|---|---|---|
| Data | |||||||||||
| US Landings | 12,820 | 11,090 | 12,070 | 11,953 | 18,182 | 8,188 | 11,632 | 12,458 | 9,449 | 10,759 | 18,489 |
| DWF Landings | 0 | 0 | 0 | 0 | 0 | 0 | 0 | 0 | 0 | 0 | 0 |
| US Discards | 368 | 246 | 208 | 97 | 498 | 131 | 134 | 315 | 586 | 580 | 447 |
| Catch for Assessment | 13,187 | 11,336 | 12,278 | 12,050 | 18,680 | 8,319 | 11,766 | 12,773 | 10,035 | 11,339 | 18,936 |
| Model Results | |||||||||||
| Total Biomass | 93,975 | 109,573 | NA | NA | 73,762 | NA | NA | 63,349 | NA | NA | 121,836 |
| Exploitation Index | 0.14 | 0.103 | 0.253 | 0.195 | 0.155 | ||||||
Table 9: Comparison of Reference Points estimated in the 2020 and current assessment updates.
| 2020 | 2023 | |
|---|---|---|
| FMSY proxy | NA | NA |
| BMSY proxy | 42,405 | 42,405 |
| MSY (mt) | NA | NA |
| Overfishing | Unknown | Unknown |
| Overfished | No | No |
Projections: Near-term stock size projections were not possible due to the lack of an analytical assessment model that accounts for the species unique life history.
Special Comments:
- •
What are the most important sources of uncertainty in this stock assessment? Explain, and describe qualitatively how they affect the assessment results (such as estimates of biomass, F, recruitment,and population projections).
For the estimation of biomass using NEFSC bottom trawl survey data, the most important source of uncertainty is the apparent productivity differences between the two intra-annual cohorts. The biomass of the cohort caught during the fall surveys is about five-fold higher than the biomass of the cohort caught in the spring surveys (NEFSC, 2011a; 2011b). However, the mean exploitation rate for the Jan.–June fishery was more than three times higher on the apparently less productive spring survey cohort. Using annualized biomass and exploitation rates to determine stock status does not account for these differences, and therefore, may impact resource sustainability. The review panel for the 2020 Level 3 assessment of this stock agreed and concluded that Annual averaging of the spring and fall survey biomasses assumes that a single population is being exploited and does not account for the large difference in apparent productivity of the two intra-annual cohorts. Cohort-specific stock size estimates and Reference Points are required to determine the stock status of cephalopod species with subannual lifespans because maturation and growth rates of intra-annual cohorts exhibit a high degree of seasonal and interannual variability (Arkhipkin et al. 2020). Because the generation time for longfin squid is only 6–8 months, overfishing of a single cohort potentially could jeopardize stock sustainability due to recruitment overfishing.
During the 2020 assessment, cohort-specific biomass Reference Points were derived separately for squid caught in the NEFSC spring versus fall bottom trawl surveys because annualized biomass estimates and Reference Points (i.e., averages of the spring and fall survey biomasses) do not account for the apparent productivity differences that exist between the two intra-annual cohorts caught during these surveys.
- •
Does this assessment model have a retrospective pattern? If so, is the pattern minor, or major? (A major retrospective pattern occurs when the adjusted SSB or FFull lies outside of the approximate joint confidence region for SSB and FFull).
These questions are not applicable to the subject assessment because an analytical model was not utilized.
- •
Based on this stock assessment, are population projections well determined or uncertain? If this stock is in a rebuilding plan, how do the projections compare to the rebuilding schedule?
Projections were not possible, because there is no anaytical model from which to do so. The stock is not currently subject to a rebuilding plan but has been in the past.
- •
Describe any changes that were made to the current stock assessment, beyond incorporating additional years of data and the effect these changes had on the assessment and stock status.
The 2009–2020 NEFSC spring and fall survey biomass indices now include actual rather than nominal tow distances, at the request of the NTAP. This resulted in minor changes to the indices that did not affect stock statuses for either cohort. For example, the difference between the two-year moving average biomass estimates for 2019 during this assessment versus the 2020 assessment represented a 3.5% increase of 2,290 mt which is inconsequential in relation to the magnitude of the 2019 biomass estimate in relation to the threshold BMSY proxy.
The other assessment methodology change involved the discard estimates for 2020–2022. Since the 2007 implementation of trimester-based quotas, discards have represented a minor portion of the catch; an average of 1.6% during 2007–2019. Nevertheless, the 2020–2022 discards were estimated using a new method with data from a new database, both of which differ from those used to estimate the 1989–2019 discards for the 2020 assessment. The new database, the CAMS database, was created and is maintained by GARFO. Some of the major differences between the two discard estimation methods and comparisons between the discard estimates for each method, during 2019–2021, are summarized in Tables 3 and 4 of the 2023 longfin squid tables file at SASINF (see2023_DORY_UNIT_TAB.pdf ). The 2019 landings were compared between the two discard estimation methods, as were the 2019–2021 discards, but only the CAMS discard estimates were available for 2022. The 2019 CAMS landings (12,489 mt) were only 31 mt (0.25%) higher than the 2019 landings from the Area Allocation database formerly used in the discard estimation method as the denominator (kept weight of all species). The higher 2019 CAMS discard estimate (357 mt, CV= 0.18) was more precise than the discard estimate based on the former discard estimation method (315 mt, CV= 0.32. However, only the CAMS discard estimates for 2020–2022 were used in this assessment, because 2019 was the terminal year of the previous assessment and the 2019 discard estimate was accepted for use in the stock status determination. When the 2019–2021 CAMS discard estimates were compared with those from the former discard estimationmethod, most of the CAMS estimates were slightly higher, but most fell within the 90% confidence interval of the discards estimated using the former method.
- •
If the stock status has changed a lot since the previous assessment, explain why this occurred.
Overfishing status is unknown for this stock because an analytical model could not be developed by the most recent benchmark assesment Working Group given the available data. There has been no change in the overfished status of longfin inshore squid since the 2020 operational assessment, for either of the two cohorts or for both cohorts combined (i.e., based on annualized biomass and biomass Reference Points). Under the current assessment process, however, stock status for this subannual species is always reported for the prior year (i.e., for multiple generations past) and this stock status is assumed to remain the same for the next three years when the next Management Track Assessment occurs. It is imperative that both squid stocks be assessed annually so that the timing of their stock status updates are appropriate for their short lifespans.
- •
Provide qualitative statements describing the condition of the stock that relate to stock status.
The use of conventional stock assessment models to assess squid stocks such as longfin inshore squid (Doryteuthis (Amerigo) pealeii), is inappropriate because they do not account for the species’ subannual lifespan and semelparous reproduction. This neritic species has a lifespan of 6–8 months, and like many other loliginids, there are two dominant intra-annual cohorts; winter-hatched and summer-hatched cohorts that have different growth rates and median sizes-at-maturity (Brodziak and Macy 1996; Macy and Brodziak 2001). Length-based models are not generally used to assess squid stocks because time-consuming, expensive aging (counting of daily increments in statoliths) must be used to identify the intra-annual cohorts due to the high plasticity in individual growth rates (Arkhipkin et al., 2015). Like most squid stocks, stock size estimates of longfin inshore squid exhibit high interannual variability because each year, the population relies on new recruits to each intra-annual cohort, and recruitment levels depend on the favorability of environmental conditions (Brodziak and Hendrickson 1999; Hatfield et al. 2001).
- •
Indicate what data or studies are currently lacking and which would be needed most to improve this stock assessment in the future.
Based on the NRCC assessment schedule, this stock is currently assessed every three years. Instead, it is recommended that this subannual species be asssessed on an annual basis, as was done historically. A Research Track Assessment is scheduled for review in 2026, following two years of research dedicated to developing a stock assessment model and Reference Points that account for the life history of this semelparous species and its two intra-annual cohorts. The research topics identified here and in previous assessments should be reviewed and prioritized prioritized by the Working Group prior to conducting any research on the stock.
During the upcoming longfin squid Research Track Assessment, the top priority should be the development of a cohort-specific assessment model that incorporates, for example, their different growth rates and median ages-at-maturity, along with spawning and non-spawning spawning natural mortality rates.
Simulation testing should be conducted to evaluate the model’s ability to accurately and precisely estimate stock conditions under a wide range of scenarios, including process and measurement errors.
A method that accounts for the species’ semelparous reproduction should be used to estimate separate MSP based Biological Reference Point proxies for each of the two intra-annual cohorts to ensure adequate spawner escapement.
Annual pre-season biomass estimates for each cohort will be necessary to set cohort-specific Annual Biological Catches and quotas. This requires a streamlined regulatory process that allows for rapid implementation of the cohort-specific quotas in order to avoid foregone yield during years of high stock size and to avoid recruitment overfishing of either cohort during years when stock size is low.
Extend the work that has been conducted on estimation of the NEFSC bottom trawl catchability of this species in both the spring versus fall bottom trawl surveys (NEFSC 2011a; Jacobson et al. 2015). Additional empirical data for estimating these catchabilities are needed to investigate the apparent productivity differences between the two cohorts caught in the NEFSC spring versus fall bottom trawl surveys. Biomass estimates for the fall NEAMAP surveys were only a small percentage of the total fall biomass, averaging 5.5% during 2009–2022, but a comparison of longfin squid catchability differences between the NEAMAP and NEFSC fall surveys might also be useful.
- •
Are there other important issues?
Life history, life history, life history!
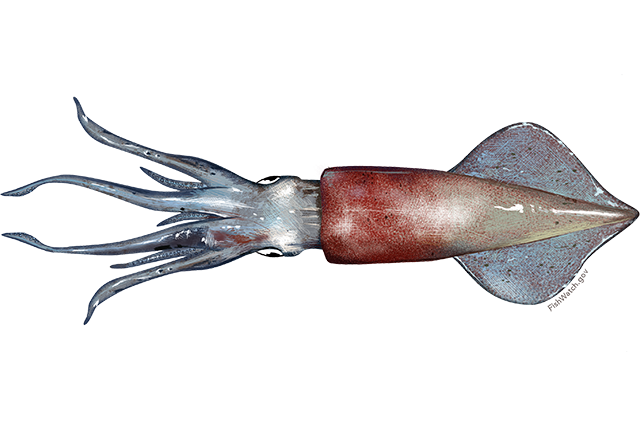
•Doryteuthis (Amerigo) pealeii, Longfin Squid.
4.1. Reviewer Comments: Longfin inshore squid
This Level 2 Management Track Assessment of longfin inshore squid (Doryteuthis (Amerigo) pealeii) is an update of the 2020 Level 3 peer-reviewed Management Track Assessment. The assessment methodology has been consistent since the 2010 benchmark assessment SAW/SARC 51 (NEFSC, 2011a; NEFSC, 2011b), followed by the 2017, 2020 and this management track update.
The assessment uses catchability corrected swept area biomass to estimate stock size. A threshold equal to half of the BMSY proxy estimate (BMSY= 42,405 mt) is used to define the overfished status of the stock. A measure of relative stock exploitation rate is calculated as a ratio of total removals to biomass, but no reference point for fishing mortality or exploitation rate is currently employed and the overfishing status is not determined.
This assessment satisfactorily updated commercial fishery harvest and discards, catchability adjusted, swept-area biomass estimates, and exploitation indices (catch / biomass) through 2022. Catches and discards for 2020–2022 were derived using the CAMS database. The indices for both surveys were corrected for the actual tow distances for each trawl tow rather than using nominal value. These corrections did not result in any significant changes.
Annualized biomass estimates as annually averaged spring and fall survey biomass estimates and annualized exploitation indices (annual catch / annually averaged spring and fall survey biomass), were also updated. Cohort-specific biomass was estimated separately for the NEFSC spring surveys versus NEFSC fall + NEAMAP fall surveys. Cohort-specific exploitation indices (Jan–June catch / spring survey biomass versus July–December catch / fall survey biomass) were updated as well. The 2022 annualized exploitation index was estimated to be 0.155 (Figure 2), which was 20.1% less than the 1987–2021 median of 0.195.
The current assessment approach does not allow the estimation of recruitment, complete retrospective analysis or do bridge runs. A Plan B assessment was not possible for this stock. Short-term projections were not conducted because there is no accepted assessment model for longfin squid.
There are currently no accepted fishing mortality reference points available for this stock. The biomass reference point BMSY proxy was defined in the past based on the historic data set when the population was lightly exploited and therefore cannot be redefined within the management track assessment. The BMSY proxy remained the same as the 2010, 2017 and 2020 assessments. Although cohort specific estimates are not currently used for the definition of the status of the stock, results suggested that neither of two cohorts were overfished.
The Review Panel supports an alternative to the annualized stock size approach for using cohortspecific reference points to provide annual stock status.
The Panel concludes that the 2023 management track assessment fulfilled the recommendations of the AOP and is technically sufficient to evaluate stock status for biomass. The assessment represents the BSIA for this stock for management purposes and meets the Terms of Reference applicable for the stock’s assessment. The Panel agrees with the assessment report that longfin squid is not overfished. The panel further notes that while the overfishing status is unknown, due to the lack of an FMSY orproxy reference point, exploitation rates generated by the historic removals resulted in both cohort and annualized estimates of biomass near or above the BMSY target values in recent years. The Panel concurs with the previous peer review recommendation to consider cohort-specific reference points based on the understanding of two dominant and largely non-overlapping intra-year cohorts of longfin squid, at the next research track assessment.
Recommendations:
- •
The Review Panel recommends considering further an option of cohort-specific reference points for determining stock status in addition to the annualized single stock BRPs.
- •
- •
It is important to understand the growth and mortality of each of the two major cohorts to determine their contribution to the total stock biomass within the season, on a monthly, or other appropriate timestep. This will also help to address the question at what stage of biomass development each cohort is intercepted by the spring and the fall survey and how changes in survey timing may affect the biomass estimates.
- •
The Panel noted that in some years the exploitation rate was above 1 when the biomass estimates from the spring survey were used. This raises an issue of the appropriateness of current gear efficiency coefficient, since we can not be removing the entire cohort in the spring. Population biomass from the spring survey is likely to be underestimated. Survey catchability and stock distribution needs to be explored in further detail to evaluate true contribution of spring cohort to stock biomass.
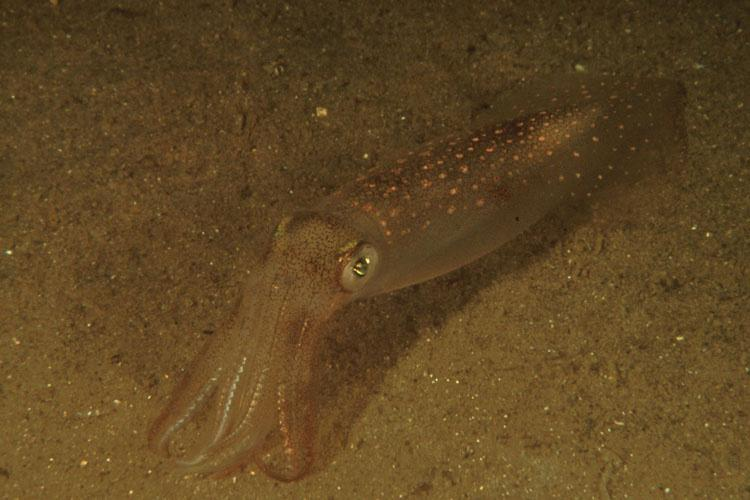
•Well camouflaged on the sandy bottom.
References:
Arkhipkin, Alexander I., Paul G.K. Rodhouse, Graham J. Pierce, Warwick Sauer, Mitsuo Sakai, Louise Allcock, Juan Arguelles, John R. Bower, Gladis Castillo, Luca Ceriola, Chih-Shin Chen, Xinjun Chen, Mariana Diaz-Santana, Nicola Downey, Angel F. Gonzalez, Jasmin Granados Amores, Corey P. Green, Angel Guerra, Lisa C. Hendrickson, Christian Ibnez, Kingo Ito, Patrizia Jereb, Yoshiki Kato, Oleg N. Katugin, Mitsuhisa Kawano, Hideaki Kidokoro, Vladimir V. Kulik, Vladimir V. Laptikhovsky, Marek R. Lipinski, Bilin Liu, Luis Maritegui, Wilbert Marin, Ana Medina,Katsuhiro Miki, Kazutaka Miyahara, Natalie Moltschaniwskyj, Hassan Moustahfid, Jaruwat Nabhitabhata, Nobuaki Nanjo, Chingis M. Nigmatullin, Tetsuya Ohtani, Gretta Pecl, J. Angel A. Perez, Uwe Piatkowski, Pirochana Saikliang, Cesar A. Salinas-Zavala, Michael Steer, Yongjun Tian, Yukio Ueta, Dharmamony Vijai, Toshie Wakabayashi, Tadanori Yamaguchi, Carmen Yamashiro, Norio Yamashita and Louis D. Zeidberg. 2015. World squid fisheries. Rev in Fish Sci and Aquacult. 23:2, 92–252.RevFSA:2015.1026226
Brodziak J.K.T., and Macy W.K. III. 1996. Growth of long-finned squid, Loligo pealeii, in the northwest Atlantic. Fish Bull. 94: 212–236.GEOMAR:2932
Arkhipkin A.I., Hendrickson L.C., Pay I., Pierce G., Roa-Ureta R., Robin J-P. and Winter A. 2020. Stock assessment and management of cephalopods: advances and challenges for short-lived fishery resources. ICES J Mar Sci. 78(2): 714–730.JMS:fsaa038
Brodziak J.K.T. and Hendrickson L.C. 1999. An analysis of environmental effects on survey catches of squids Loligo pealei and Illex illecebrosus in the northwest Atlantic. Fish B-NOAA 97(1): 9–24.CRD97-03
Hatfield E.M.C., Hanlon R.T., Forsythe J.W. and Grist E.P.M. 2001. Laboratory testing of a growth hypothesis for juvenile squid Loligo pealeii (Cephalopoda: Loliginidae). Can J Fish Aquat Sci. 58: 845–857.CJFAS:f01-030
Jacobson L.D., Hendrickson L.C. and Tang J. 2015. Solar zenith angles for biological research and an expected catch model for diel vertical migration patterns that affect stock size estimates for longfin inshore squidDoryteuthis (Amerigo) pealeii. Can J Fish Aquat Sci. 72: 1329–1338.CJFAS:2014-0436
Macy, W.K. III and Brodziak J.K.T. 2001. Seasonal maturity and size at age of Loligo pealeii in waters of southern New England. ICES J Mar Sci. 58 (4): 852–864.JMSC:2001.1076
Northeast Fisheries Science Center [NEFSC], 2020. Longfin inshore squid 2020 Assessment Update Report. 10p.StockSMART:10792
Northeast Fisheries Science Center [NEFSC], 2011a. 51st Northeast Regional Stock Assessment Workshop (51st SAW) Assessment Report. US Dept Commer, Northeast Fish Sci Cent Ref Doc. 11-02, 856p.CRD11-02
Northeast Fisheries Science Center [NEFSC], 2011b. 51st Northeast Regional Stock Assessment Workshop (51st SAW) Assessment Summary Report. US Dept Commer, Northeast Fish Sci Cent Ref Doc. 11-01, 70p.CRD11-01
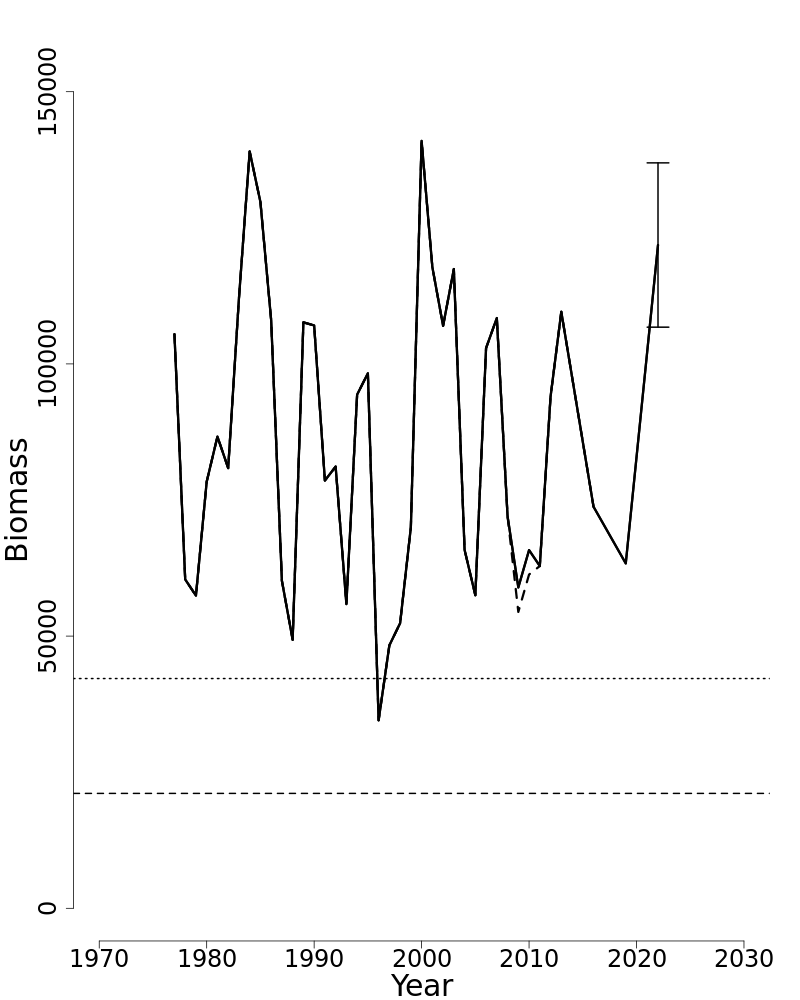
Figure 8: Trends in the two-year moving averages of annualized q-adjusted, swept-area biomass (i.e., annually averaged NEFSC spring and fall survey biomasses, in mt) of longfin inshore squid from the current assessment (solid line) and the 2020 assessment updates (dashed line). Biomass estimates are shown as interpolated values for years where biomass could not be estimated due to inadequate survey sampling coverage of longfin squid habitat (i.e., 2014 and 2020 spring and 2017 and 2020 fall surveys). The 80% confidence limits (106,748–136,923) are shown for the 2022 biomass estimate (121,836 mt) in relation to the BMSY proxy (42,405 mt) and BThreshold (21,203 mt).
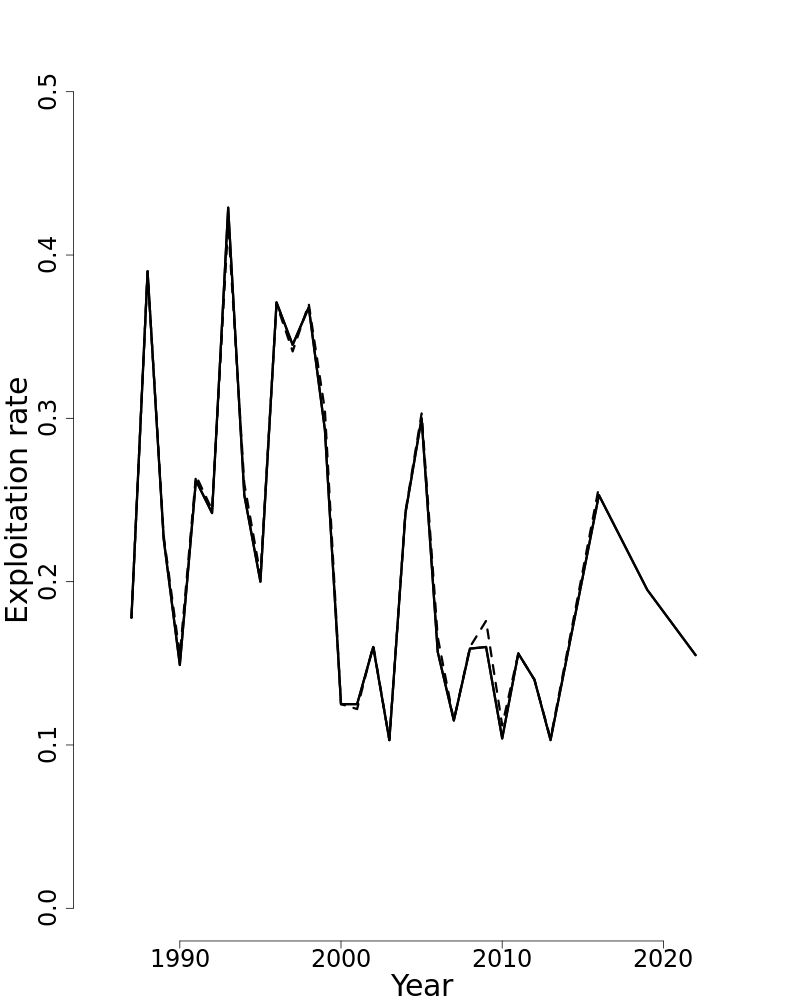
Figure 9: Trends in annualized exploitation indices (annual catch/two-year moving average of the annualized NEFSC spring and fall survey biomass estimates) of longfin inshore squid during the US fishery time period (between 1987 and 2022 from the current assessment (solid line) and the 2020 assessment updates (dashed line). Exploitation rates are shown as interpolated values for years with only a single biomass estimate due to inadequate survey sampling coverage of longfin squid habitat (i.e., the 2014 and 2020 spring and 2017 and 2020 fall surveys).
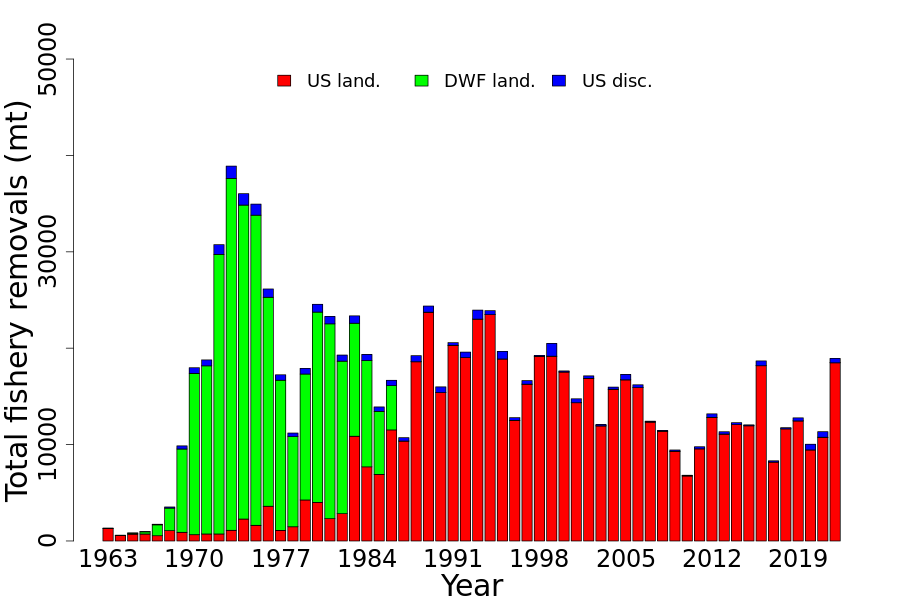
Figure 10: Total catches of longfin inshore squid between 1963 and 2022 by fleet (commercial) and disposition (landings or discards). DWF landings are the Distant Water Fleet landings, but the discards for this fleet are unknown.
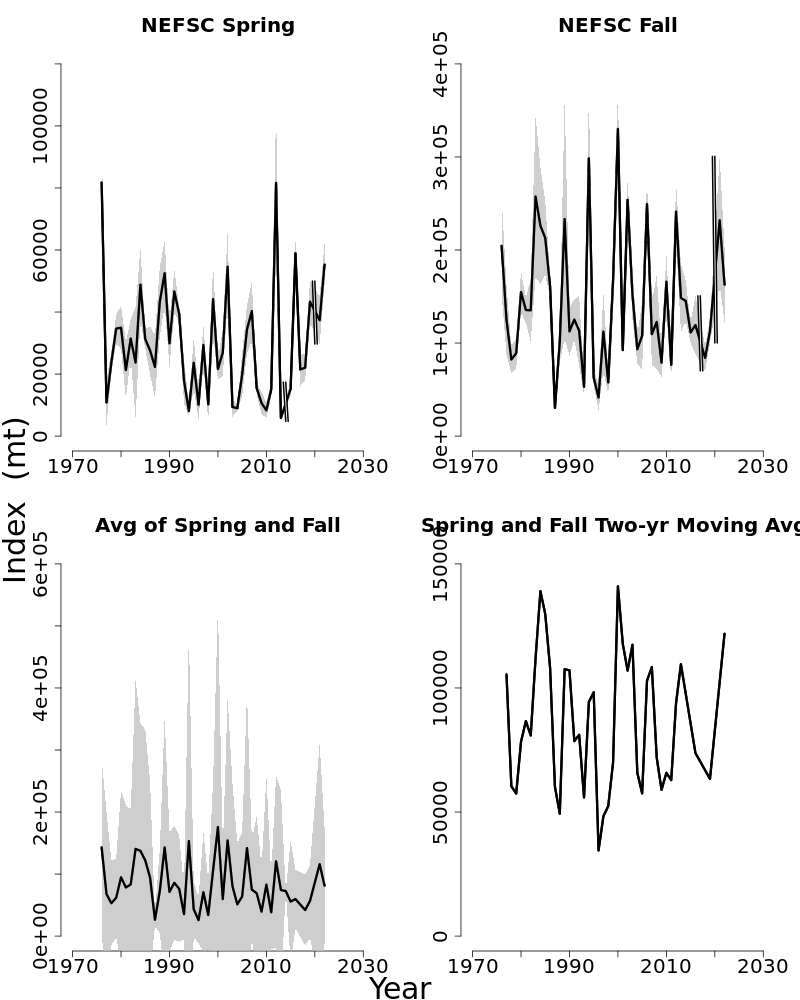
Figure 11: Swept-area, q-adjusted biomass estimates (mt) for longfin inshore squid between 1976 and 2022 for the NEFSC spring and fall bottom trawl surveys (top panels), annualized NEFSC survey biomass (i.e., averages of the biomass estimates for these two surveys) and two-year moving averages of the annualized biomass estimates. Due to inadequate survey sampling coverage of longfin squid habitat during the 2014 and 2020 spring surveys and the 2017 and 2020 fall surveys, biomass estimates during these years are not shown in the two top panels, but have been interpolated in the biomass time series shown in the bottom panels.
5. SUMMER FLOUNDER
This assessment of the Summer flounder (Paralichthys dentatus) stock is an update of the existing 2021 Management Track Assessment (NEFSC 2022). Based on the previous assessment the stock was not overfished and overfishing was not occurring. This 2023 Management Track Assessment updates fishery catch data, research survey indices of abundance, the ASAP assessment model, and biological reference points through 2022. Additionally, stock projections have been updated through 2025.
State of Stock: Based on this updated assessment, the Summer flounder (Paralichthys dentatus) stock is not overfished and overfishing is occurring (Figures 12–13). Retrospective adjustments were not made to the model results. Spawning Stock Biomass (SSB) in 2022 was estimated to be 40,994 mt which is 83% of the biomass target for this stock (SSBMSY proxy= 49,561; Figure 12). The 2022 fully selected fishing mortality was estimated to be 0.464 which is 103% of the overfishing threshold proxy (FMSY proxy= 0.451; Figure 13).
Table 10: Catch and model results for Summer flounder. All weights are in mt, recruitment is in 000s, and FFull is the fishing mortality on fully-selected age-4. Model results are unadjusted values from the current updated ASAP assessment.
| 2013 | 2014 | 2015 | 2016 | 2017 | 2018 | 2019 | 2020 | 2021 | 2022 | |
|---|---|---|---|---|---|---|---|---|---|---|
| Data | ||||||||||
| Commercial landings | 5,696 | 4,989 | 4,858 | 3,537 | 2,644 | 2,787 | 4,109 | 4,282 | 4,936 | 5,683 |
| Commercial discards | 863 | 830 | 703 | 772 | 906 | 979 | 783 | 1,163 | 873 | 680 |
| Recreational landings | 8,806 | 7,364 | 5,366 | 6,005 | 4,565 | 3,447 | 3,537 | 4,571 | 3,092 | 3,916 |
| Recreational discards | 2,119 | 2,092 | 1,572 | 1,482 | 1,496 | 1,003 | 1,379 | 1,141 | 997 | 1,336 |
| Catch for Assessment | 17,483 | 15,275 | 12,498 | 11,796 | 9,611 | 8,216 | 9,808 | 11,157 | 9,898 | 11,615 |
| Model Results | ||||||||||
| Spawning Stock Biomass | 52,155 | 47,841 | 42,424 | 39,209 | 37,040 | 37,599 | 38,846 | 43,024 | 41,615 | 40,994 |
| FFull | 0.473 | 0.439 | 0.427 | 0.428 | 0.345 | 0.304 | 0.37 | 0.417 | 0.371 | 0.464 |
| Recruits (age-0) | 35,208 | 38,700 | 27,000 | 30,551 | 38,876 | 43,028 | 39,933 | 35,629 | 42,323 | 38,371 |
Table 11: Comparison of biological reference points estimated in the previous assessment and from the current assessment update. An F35% proxy was used for the overfishing threshold and SSB and MSY proxies were based on long-term stochastic projections.
| 2021 | 2023 | |
|---|---|---|
| FMSY proxy | 0.422 | 0.451 |
| SSBMSY (mt) | 55,217 | 49,561 (38,181–64,301) |
| MSY (mt) | 15,872 | 14,097 (11,020–18,114) |
| Median recruits (age-1) (000s) | 49,954 | 46,966 |
| Overfishing | No | Yes |
| Overfished | No | No |
Projections: Short term projections of catch (OFL) and Spawning Stock Biomass (SSB) were derived by sampling from an empirical cumulative distribution function of the 12 most recent recruitment estimates from the ASAP model results (2011–2022). The annual fishery selectivity, maturity ogive, and mean weights-at-age used in projections are the most recent 5-year averages; no retrospective adjustments were applied in the projections.
Table 12: Short term projections of total fishery catch (OFL) and Spawning Stock Biomass (SSB) for Summer flounder based on a harvest scenario of fishing at FMSY proxy between 2024 and 2025. Catch in 2023 was assumed to be 15,023 (mt).
| Year | Catch (mt) | SSB (mt) | FFull |
|---|---|---|---|
| 2023 | 15,023 | 37,233 (30,000–46,000) | 0.622 |
| Year | Catch (mt) | SSB (mt) | FFull |
| 2024 | 10,422 | 38,541 (32,000–46,000) | 0.451 |
| 2025 | 10,839 | 39,127 (33,000–46,000) | 0.451 |
Special Comments:
- •
What are the most important sources of uncertainty in this stock assessment? Explain, and describe qualitatively how they affect the assessment results (such as estimates of biomass, F, recruitment, and population projections).
Declining trends in growth rates and changes in the sex-ratio at age may change the productivity of the stock and in turn affect estimates of the biological reference points. Changes in growth, maturity, and recruitment may be environmentally mediated but mechanisms are unknown.
- •
Does this assessment model have a retrospective pattern? If so, is the pattern minor, or major? (A major retrospective pattern occurs when the adjusted SSB or FFull lies outside of the approximate joint confidence region for SSB and FFull).
The 7-year Mohn’s ρ, relative to SSB, was 0.03 in the 2021 assessment and was 0.06 in this assessment. The 7-year Mohn’s ρ, relative to F, was 0.01 in the 2021 assessment and was 0.03 in this assessment. No retrospective adjustment of SSB or F in 2022 was required.
- •
Based on this stock assessment, are population projections well determined or uncertain? If this stock is in a rebuilding plan, how do the projections compare to the rebuilding schedule?
Population projections for Summer flounder are reasonably well determined.
- •
Describe any changes that were made to the current stock assessment, beyond incorporating additional years of data and the effect these changes had on the assessment and stock status.
No major changes, other than the addition of three years of data, were made to the Summer flounder assessment for this update. Minor changes to the survey input CVs and fishery and survey input Effective Sample Sizes improved model diagnostics but had limited affects on the model results.
- •
If the stock status has changed a lot since the previous assessment, explain why this occurred.
Overfishing status has changed since the last assessment for Summer flounder. The stock status remains as not overfished but overfishing is occurring.
- •
Provide qualitative statements describing the condition of the stock that relate to stock status.
The current fishing mortality rate is near the threshold, and so recent near-average recruitment has resulted in relatively stable SSB. SSB is projected to remain relatively stable in the short term at current fishing rates.
- •
Indicate what data or studies are currently lacking and which would be needed most to improve this stock assessment in the future.
The Summer flounder assessment could be improved with more intensive and comprehensive sampling of the fishery catch by sex.
- •
Are there other important issues?
Sufficient length and age sampling of the fishery catch needs to be maintained.
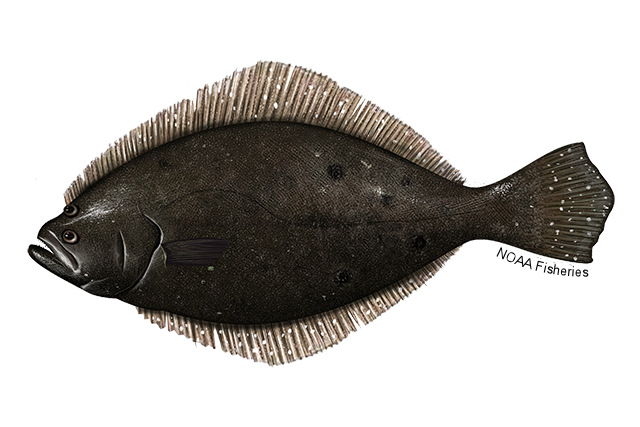
•Paralichthys dentatus, Summer Flounder.
5.1. Reviewer Comments: Summer flounder
The 2023 assessment of the summer flounder (Paralichthys dentatus) stock is the Management Track update of the 2021 management track assessment (NEFSC 2022). The last benchmark assessment for this stock was in 2018 (NEFSC 2018). This assessment uses the NOAA ToolBox Age-Structured Assessment Program (ASAP) and updates commercial and recreational fishery catch data, research survey indices of abundance, weights and maturity at age, and reference points through 2022. Stock projections have been updated through 2025. Splitting the final selectivity block for all fleets was also explored, but it resulted in marginally worse diagnostics and was not included in the final model.
Retrospective adjustments of the model results were not necessary. Spawning stock biomass (SSB) in 2022 was estimated to be 40,994 mt which is 83% of the biomass target for this stock (SSBMSY proxy= 49,561 mt). The 2022 fully selected fishing mortality was estimated to be 0.464 which is 103% of the overfishing threshold proxy (FMSY proxy=F35%SPR= 0.451). Based on this updated assessment, the summer flounder stock is not overfished but overfishing is occurring.
Short term projections were conducted in AGEPRO. For projection specifications, 2023 removals were assumed equal to the 2023 ABC of 15,023 mt, as approximately 96% of the ABC has been caught in recent years, and then fishing mortality was set equal to F35%SPR for 2024–2025. The projections used the most recent 5-year averages for the annual fishery selectivity, maturity ogive, and mean weights at age; no retrospective adjustments were applied in the projections. The estimated OFLs from the short term projections were 10,422 mt for 2024 and 10,839 mt for 2025.
The Panel concluded that the 2023 assessment update for Summer flounder fulfilled the recommendations of the AOP, is technically sufficient to evaluate stock status and provide scientific advice and meets the Terms of Reference for the stock’s assessment. The assessment represents Best Scientific Information Available for this stock for management purposes.
The Panel discussed the change in the estimated size of the 2018 year-class from the 2021 Management Track Assessment to this assessment, the potential decline in productivity in recent years due to decreasing weight-at-age and proportion female-at-age, and the resulting impact on stock status and catch advice. The 2021 assessment estimated the 2018 year-class at 61 million fish, well above the time-series average, while the 2023 assessment estimated it at 43 million fish, more in line with recent estimates of recruitment and below the time-series average. The estimates of SSB in recent years were also revised downwards, a function of the minor retrospective pattern that this model exhibits. Lower estimates of abundance in recent years, the lower estimate of the 2018 year-class, and the lower mean weight-atage in recent years combined to produce OFL estimates that were lower than the 2021–2023 OFLs from the 2021 assessment. The increasing trend in biomass from 2017 onwards was somewhat arrested from 2020–2022 by the higher F and lower weights-at-age, but the stock remains above the biomass threshold, consistent with the increasing trends in survey indices and the expanded age-structure of the catch, especially for males. The Panel discussed concerns raised by previous panels about the impact of increasing size limits on a species where females grow faster and reach larger sizes than males do. The proportion of females in the survey data has declined since the start of the time series, but has stabilized at about 50% for all ages in recent years; more older males have been observed in the survey and catch data as well, indicating that the lower overall F rate on the population has allowed the males to survive to older agesand may balance out the potential negative effects of the higher size limit on females.
The Panel agreed with the analyst’s conclusion not to split the final selectivity blocks, as it did not improve model performance and there was no evidence presented for changes in the fisheries to justify the split.
The Panel recommended reevaluating the suite of indices used to fit the model in the next research track assessment, as the model currently includes 14+ indices, some of which provide conflicting information and end up being down-weighted to get a RMSE near one.
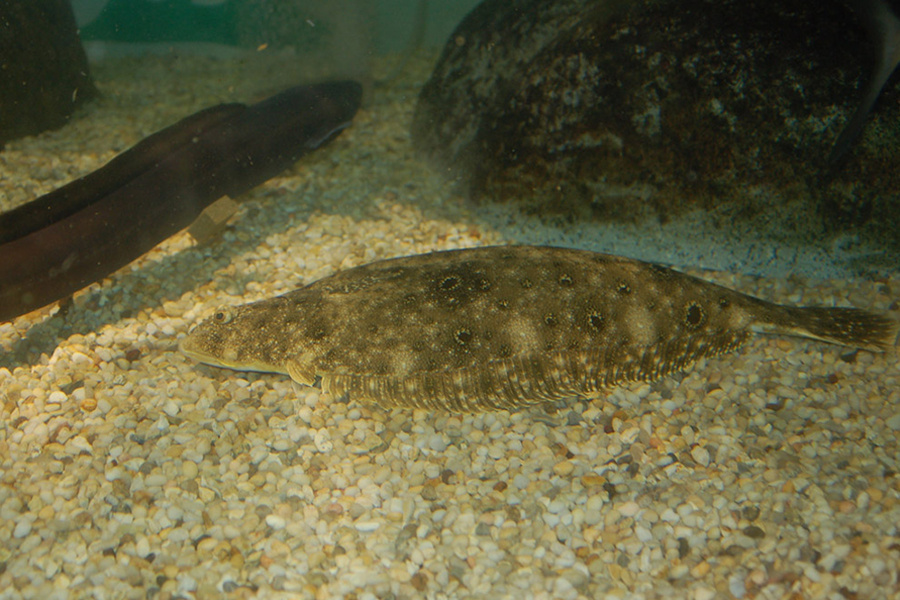
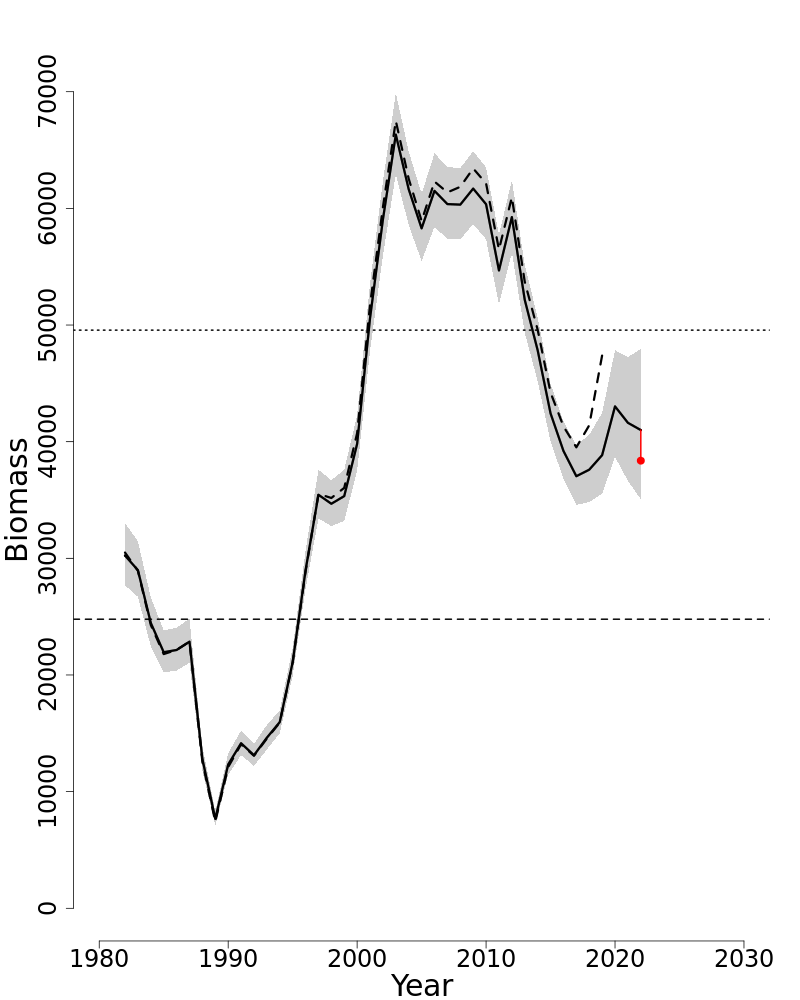
Figure 12: Trends in spawning stock biomass of Summer flounder between 1982 and 2022 from the current (solid line) and previous (dashed line) assessment and the corresponding SSBThreshold (1/2 SSBMSY proxy; horizontal dashed line) as well as SSBTarget (SSBMSY proxy; horizontal dotted line) based on the 2023 assessment. Biomass adjusted for a retrospective pattern is shown in red, but not used for stock status or projections. The approximate 90% log-normal confidence intervals are shown.
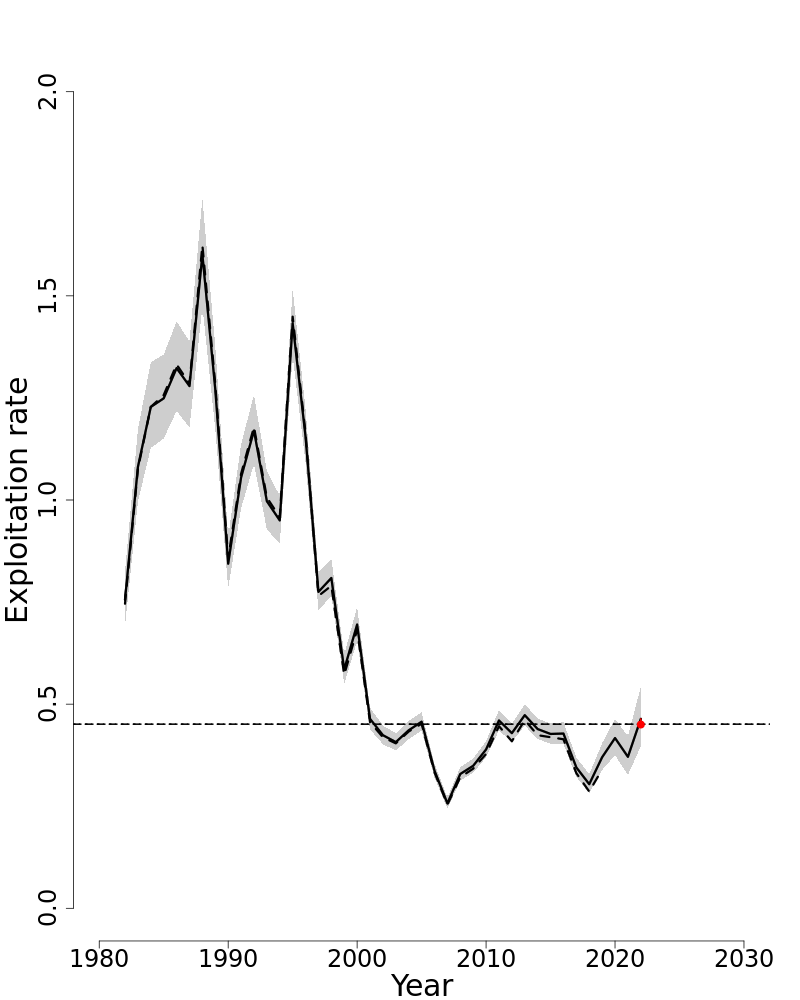
Figure 13: Trends in the fully selected fishing mortality (FFull) of Summer flounder between 1982 and 2022 from the current (solid line) and previous (dashed line) assessment and the corresponding FThreshold (FMSY proxy=0.451; horizontal dashed line). FFull adjusted for a retrospective pattern is shown in red, but not used for status or projections. The approximate 90% log-normal confidence intervals are shown.
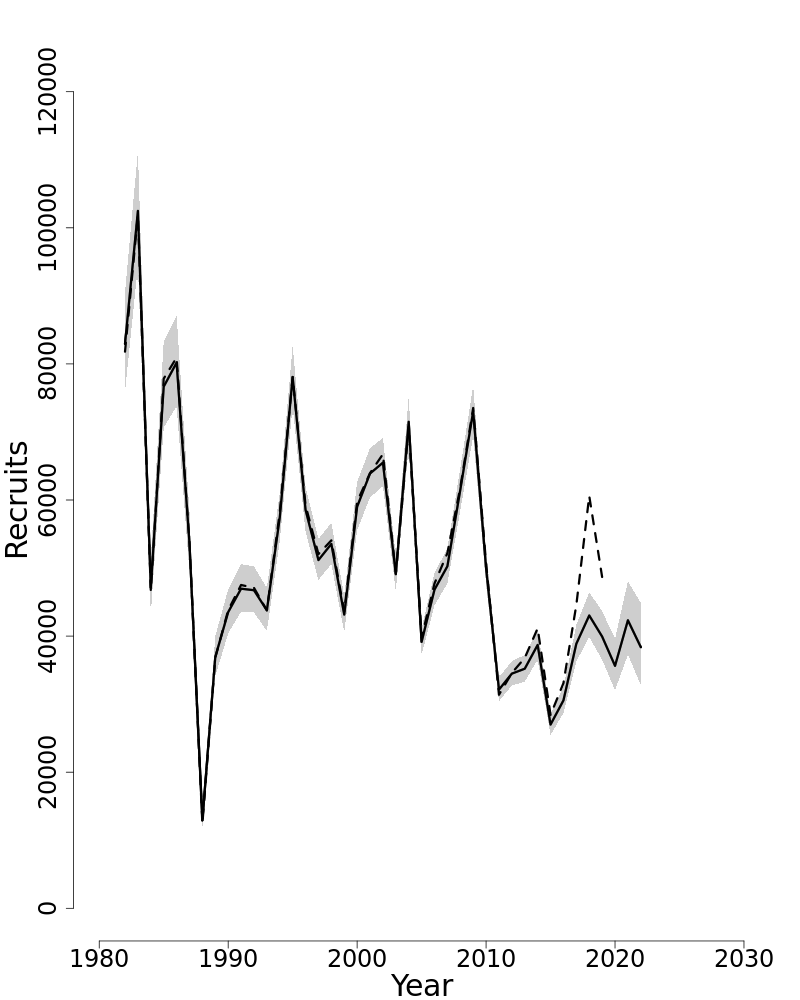
Figure 14: Trends in Recruits (age-0) (000s) of Summer flounder between 1982 and 2022 from the current (solid line) and previous (dashed line) assessment.
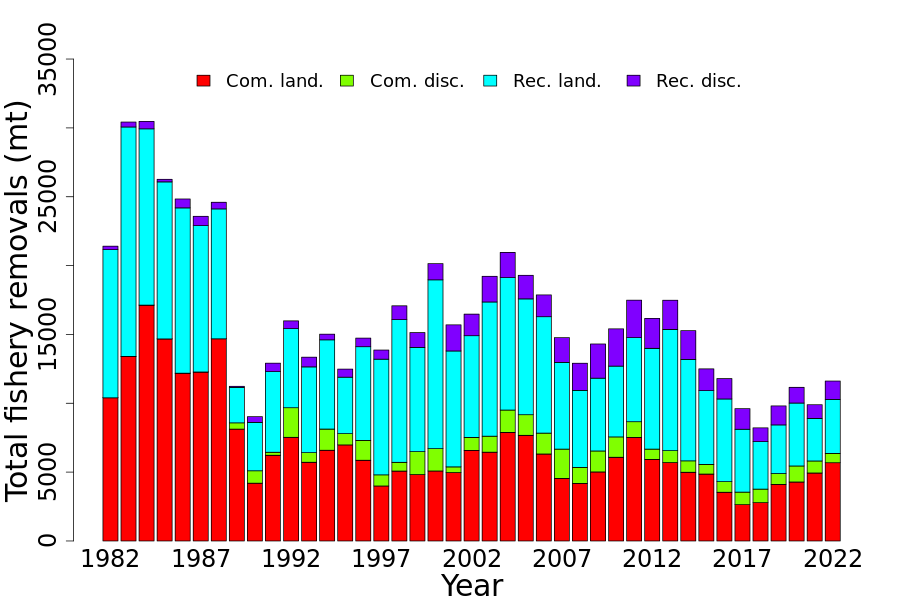
Figure 15: Total catch of Summer flounder between 1982 and 2022 by fishery (commercial and recreational) and disposition (landings and discards).
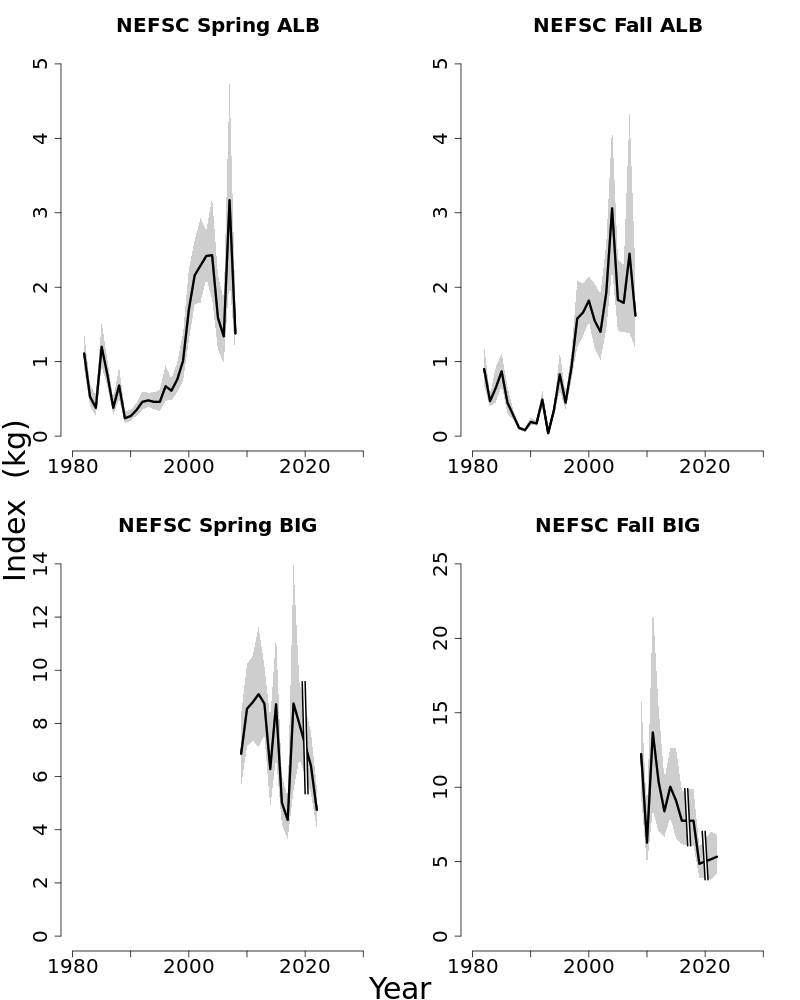
Figure 16: Indices of biomass for the Summer flounder between 1982 and 2022 for the Northeast Fisheries Science Center (NEFSC) Albatross (ALB) and Henry B. Bigelow (BIG) spring and fall research bottom trawl survey series. The approximate 90% log-normal confidence intervals are shown.
6. SCUP
This assessment of the Scup (Stenotomus chrysops) stock is an update of the existing 2021 Management Track Assessment (NEFSC 2022). Based on the previous assessment the stock was not overfished and overfishing was not occurring. This 2023 Management Track Assessment updates fishery catch data, research survey indices of abundance, the ASAP assessment model, and biological reference points through 2022. Additionally, stock projections have been updated through 2025.
State of Stock: Based on this updated assessment, the Scup (Stenotomus chrysops) stock is not overfished and overfishing is not occurring (Figures 17–18). Retrospective adjustments were made to the model results. Adjusted Spawning Stock Biomass (SSB) in 2022 was estimated to be 193,087 mt which is 246% of the biomass target for this stock (SSBMSY proxy= 78,593; Figure 17). The adjusted 2022 fully selected fishing mortality was estimated to be 0.098 which is 52% of the overfishing threshold proxy (FMSY proxy= 0.19; Figure 18).
Table 13: Catch and model results for Scup. All weights are in mt, recruitment is in 000s, and FFull is the fishing mortality on fully-selected age-4. Model results are unadjusted values from the current updated ASAP assessment.
| 2013 | 2014 | 2015 | 2016 | 2017 | 2018 | 2019 | 2020 | 2021 | 2022 | |
|---|---|---|---|---|---|---|---|---|---|---|
| Data | ||||||||||
| Commercial landings | 8,105 | 7,239 | 7,725 | 7,147 | 7,007 | 6,064 | 6,252 | 6,177 | 5,944 | 5,507 |
| Commercial discards | 1,350 | 981 | 1,718 | 2,778 | 4,733 | 3,293 | 2,779 | 2,611 | 1,895 | 2,171 |
| Recreational landings | 5,739 | 4,659 | 5,527 | 4,536 | 6,143 | 5,887 | 6,403 | 5,863 | 7,540 | 7,875 |
| Recreational discards | 568 | 480 | 581 | 862 | 1,079 | 644 | 560 | 541 | 653 | 738 |
| Catch for Assessment | 15,762 | 13,359 | 15,550 | 15,322 | 18,961 | 15,888 | 15,994 | 15,192 | 16,032 | 16,291 |
| Model Results | ||||||||||
| Spawning Stock Biomass | 229,544 | 224,345 | 202,517 | 224,568 | 242,893 | 240,870 | 226,966 | 216,046 | 184,801 | 159,050 |
| FFull | 0.105 | 0.093 | 0.118 | 0.094 | 0.1 | 0.08 | 0.09 | 0.092 | 0.129 | 0.171 |
| Recruits (age-0) | 145,750 | 360,860 | 569,175 | 256,961 | 119,279 | 138,889 | 64,735 | 118,918 | 124,873 | 106,037 |
Table 14: Comparison of biological reference points estimated in the previous assessment and from the current assessment update. An F40%SPR proxy was used for the overfishing threshold and SSB and MSY proxies were based on long-term stochastic projections.
| 2021 | 2023 | |
|---|---|---|
| FMSY proxy | 0.200 | 0.190 |
| SSBMSY (mt) | 90,019 | 78,593 (55,125–113,507) |
| MSY (mt) | 12,671 | 11,959 (8,447–17,427) |
| Median recruits (age-1) (000s) | 123,492 | 129,293 |
| Overfishing | No | No |
| Overfished | No | No |
Projections: Short term projections of catch (OFL) and Spawning Stock Biomass (SSB) were derived by sampling from an empirical cumulative distribution function of the time series of recruitment estimates from the ASAP model results for 1984–2022. The annual fishery selectivity, maturity ogive, and mean weights at age used in projections are the most recent 5-year averages; retrospective adjustments were applied in the projections.
Table 15: Short term projections of total fishery catch (OFL) and Spawning Stock Biomass (SSB) for Scup based on a harvest scenario of fishing at FMSY proxy between 2024 and 2025. Catch in 2023 was assumed to be 13,458 (mt).
| Year | Catch (mt) | SSB (mt) | FFull |
|---|---|---|---|
| 2023 | 13,458 | 209,407 (155,000–286,000) | 0.115 |
| Year | Catch (mt) | SSB (mt) | FFull |
| 2024 | 20,295 | 185,475 (138,000–252,000) | 0.190 |
| 2025 | 18,363 | 162,716 (121,000–221,000) | 0.190 |
Special Comments:
- •
What are the most important sources of uncertainty in this stock assessment? Explain, and describe qualitatively how they affect the assessment results (such as estimates of biomass, F, recruitment, and population projections).
Declining trends in growth rates and maturity at age may change the productivity of the stock and in turn affect estimates of the biological reference points. Changes in growth, maturity, and recruitment may be environmentally mediated but mechanisms are unknown.
- •
Does this assessment model have a retrospective pattern? If so, is the pattern minor, or major? (A major retrospective pattern occurs when the adjusted SSB or FFull lies outside of the approximate joint confidence region for SSB and FFull).
The 7-year Mohn’s ρ, relative to SSB, was −0.14 in the 2021 assessment and was −0.21 in this assessment. The 7-year Mohn’s ρ, relative to F, was 0.20 in the 2021 assessment and was 0.42 in this assessment. There was a major retrospective pattern for this assessment because the ρ-adjusted estimates of 2022 SSB (SSBρ= 193,087) and 2022 F (Fρ= 0.098) were outside the approximate 90% confidence regions around SSB (131,720–192,050) and F (0.14–0.208). A retrospective adjustment was made for both the determination of stock status and for projections of catch and biomass in 2024 and 2025. The retrospective adjustment changed the 2022 SSB from 159,050 to 193,087 and the 2022 FFull from 0.171 to 0.098.
- •
Based on this stock assessment, are population projections well determined or uncertain? If this stock is in a rebuilding plan, how do the projections compare to the rebuilding schedule?
Population projections for Scup are reasonably well determined.
- •
Describe any changes that were made to the current stock assessment, beyond incorporating additional years of data and the effect these changes had on the assessment and stock status.
No major changes, other than the addition of three years of data, were made to the Scup assessment for this update. Minor changes to the survey input CVs and fishery and survey input Effective Sample Sizes improved model diagnostics but had limited affects on the model results.
- •
If the stock status has changed a lot since the previous assessment, explain why this occurred.
As in recent assessments for Scup the stock status remains as not overfished and overfishing not occurring.
- •
- •
Indicate what data or studies are currently lacking and which would be needed most to improve this stock assessment in the future.
The Scup assessment could likely be improved with more intensive sampling of the fishery catch.
- •
Are there other important issues?
Sufficient length and age sampling of the fishery catch needs to be maintained.
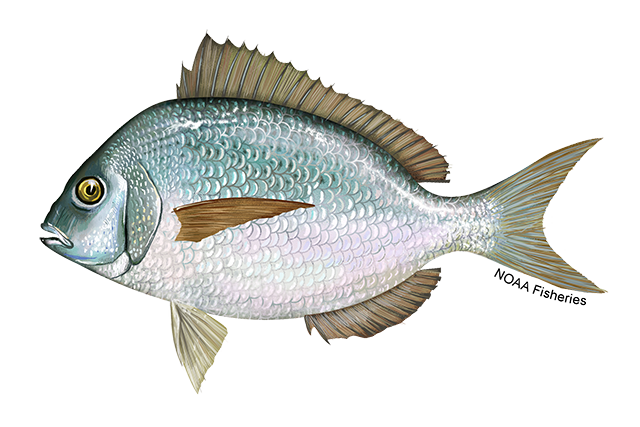
•Stenotomus chrysops, Scup.
6.1. Reviewer Comments: Scup
The 2023 assessment for scup (Stenotomus chrysops) updates the 2021 management track ASAP assessment (NEFSC 2022). This assessment updates recreational and commercial fishery catch (landings and discards), survey indices of abundance, the analytical ASAP model, and reference points through 2022. Additionally, stock projections have been updated through 2025. There was a retrospective pattern in both SSB and F (SSBρ=−21%; Fρ= +43%) that required adjustments to the terminal estimates in the model, as the adjusted values fell outside the 90% confidence interval estimates from the model. The adjusted spawning biomass in 2022 of 193,097 mt is 246% of the biomass target (SSBMSY proxy= 78,593 mt), and the adjusted fully-selected F of 0.098 was 52% of the overfishing threshold (FMSY= 0.19). Based on these estimates from the updated model, scup is not overfished, and overfishing is not occurring.
Short-term projections of biomass were done, starting with the retrospectively-adjusted terminal abundance. Future recruitments were sampled from a cumulative distribution function of updated model estimates (1984–2022 year class), and future selectivity, maturity, and weight-at-age were based on the most recent five year averages (2018–2022). Projections were run with F=FMSY to determine the OFL in 2024 and 2025 for use in the Mid-Atlantic control rule. The estimated OFL from the projection was 20,295 mt in 2024, and 18,363 mt in 2025.
The Panel concluded that the 2023 assessment update for scup fulfilled the recommendations of the AOP, is technically sufficient to evaluate stock status and provide scientific advice and meets the Terms of Reference for the stock’s assessment. The assessment represents Best Scientific Information Available (BSIA) for this stock for management purposes.
The Panel noted that the retrospective pattern has increased from previous assessments, and there was some discussion about the possible causes. The analyst noted that possible mechanisms include decreasing M, overestimated catches, and changes in catchability. The panel feels that exploration into these mechanisms is warranted if the retrospective pattern continues, but acknowledges that it is very challenging to quantify changes in M and bias in catch estimates. The model currently uses a combined index of abundance of the NEFSC survey (Albatross and Bigelow), and splitting the survey time series into two may help address the retrospective pattern.
Port sampling of commercial landings has declined for scup in recent years, with the lowest number of samples in 2022. This reduced port sampling is affecting all commercially-exploited stocks, but the Panel is concerned that it may be particularly problematic for a stock like scup where older ages are primarily collected in the commercial fishery.
The Panel noted that all four fleets in the model (recreational and commercial landings and discards) had dome-shaped selectivity. The Panel recommends continued exploration of the functional form of the selectivity across fleets, and whether there could be a mechanistic explanation for the dome across fleets.
Scup has exhibited declines in mean weights-at-age over time, and these declines contributed to the large change in SSBMSY from the previous assessment. The analyst noted that the declines in weight-atage were coincident with increases in scup biomass, and the Panel agrees that exploration of the potential for density-dependent growth is worthwhile, as it might allow for more accurate forecasts of weight in the projections.
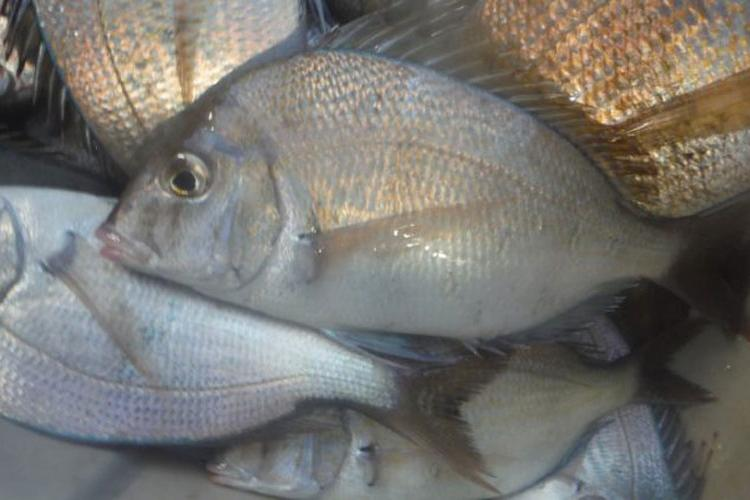
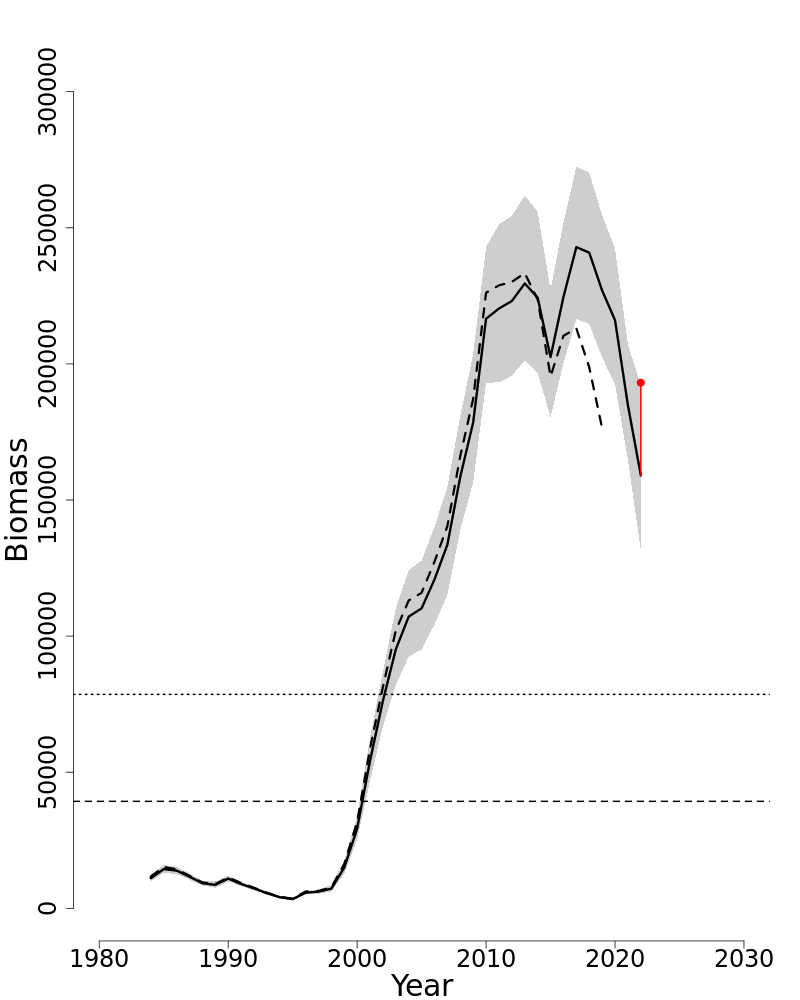
Figure 17: Trends in SSB of Scup between 1984 and 2022 from the current (solid line) and previous (dashed line) assessment and the corresponding SSBThreshold (1/2 SSBMSY proxy; horizontal dashed line) as well as SSBTarget (SSBMSY proxy; horizontal dotted line) based on the 2023 assessment. SSB was adjusted for a retrospective pattern and the adjustment is shown in red. The approximate 90% log-normal confidence intervals are shown.
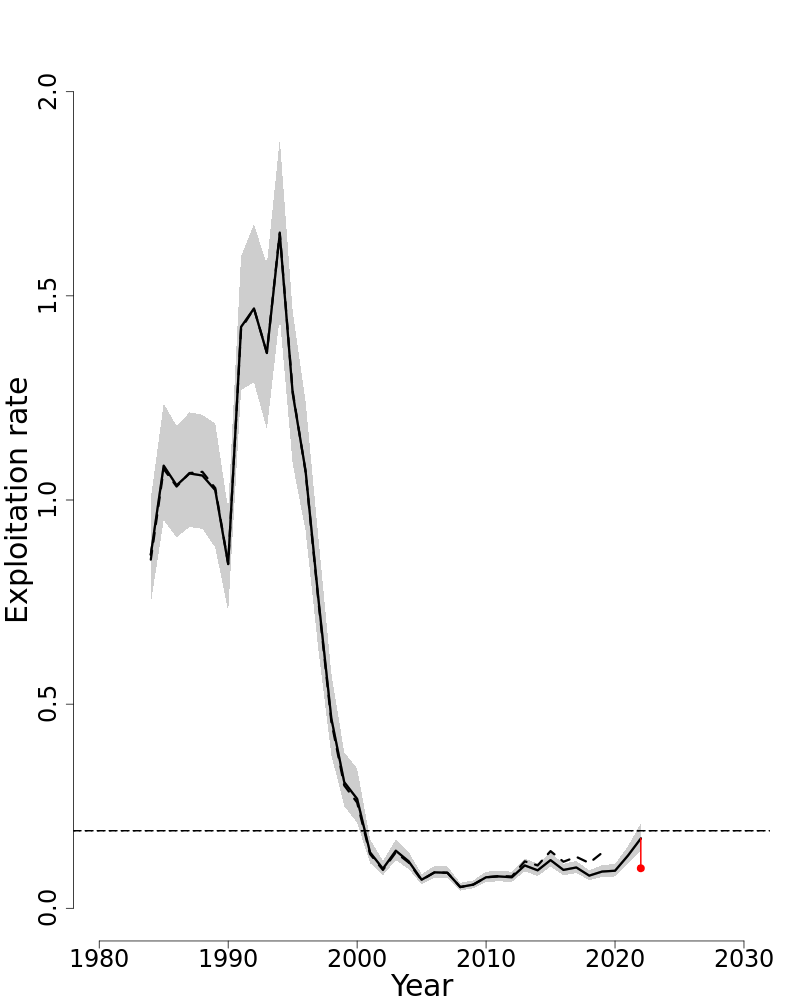
Figure 18: Trends in the fully selected fishing mortality (FFull) of Scup between 1984 and 2022 from the current (solid line) and previous (dashed line) assessment and the corresponding FThreshold (FMSY proxy=0.19; horizontal dashed line) based on the 2023 assessment.FFull was adjusted for a retrospective pattern and the adjustment is shown in red. The approximate 90% log-normal confidence intervals are shown.
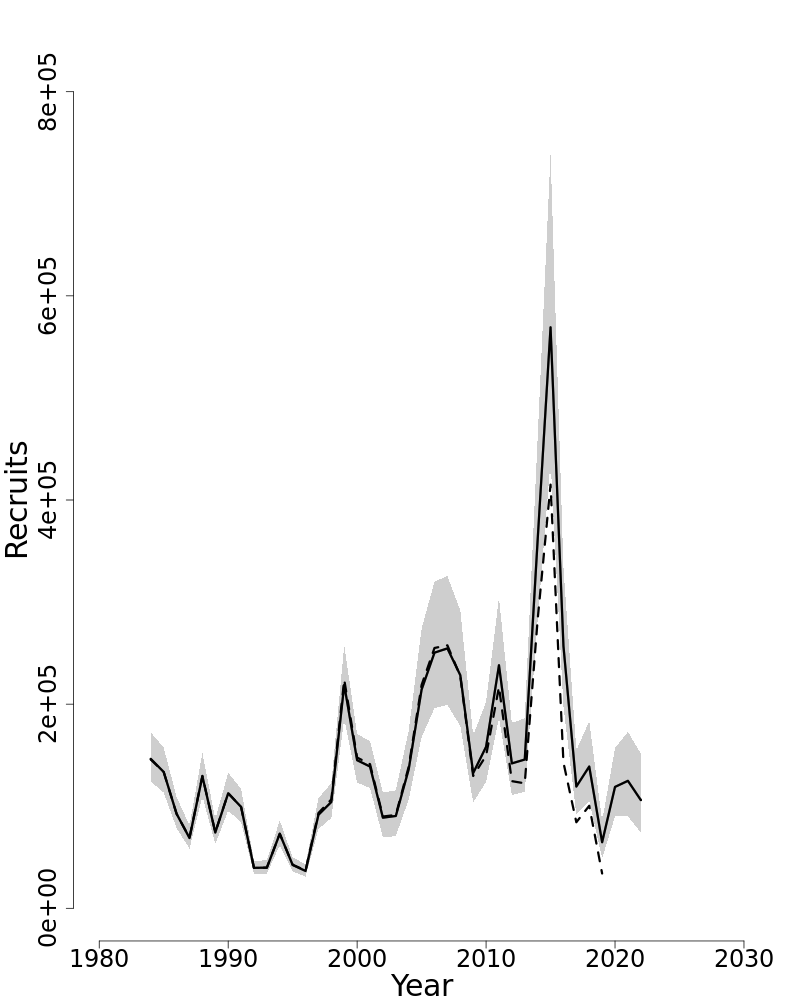
Figure 19: Trends in Recruits (age-0) (000s) of Scup between 1984 and 2022 from the current (solid line) and previous (dashed line) assessment.
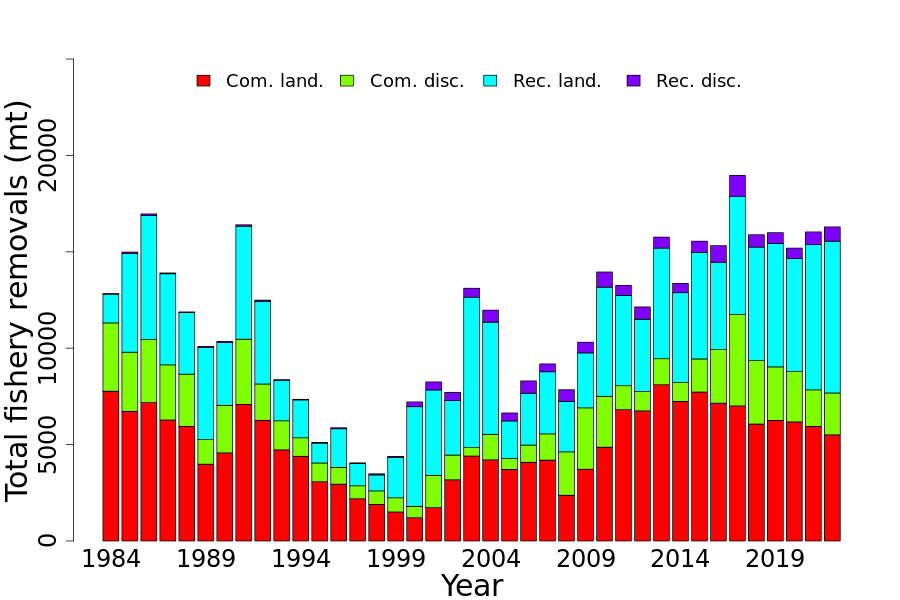
Figure 20: Total catch of Scup between 1984 and 2022 by fishery (commercial and recreational) and disposition (landings and discards).
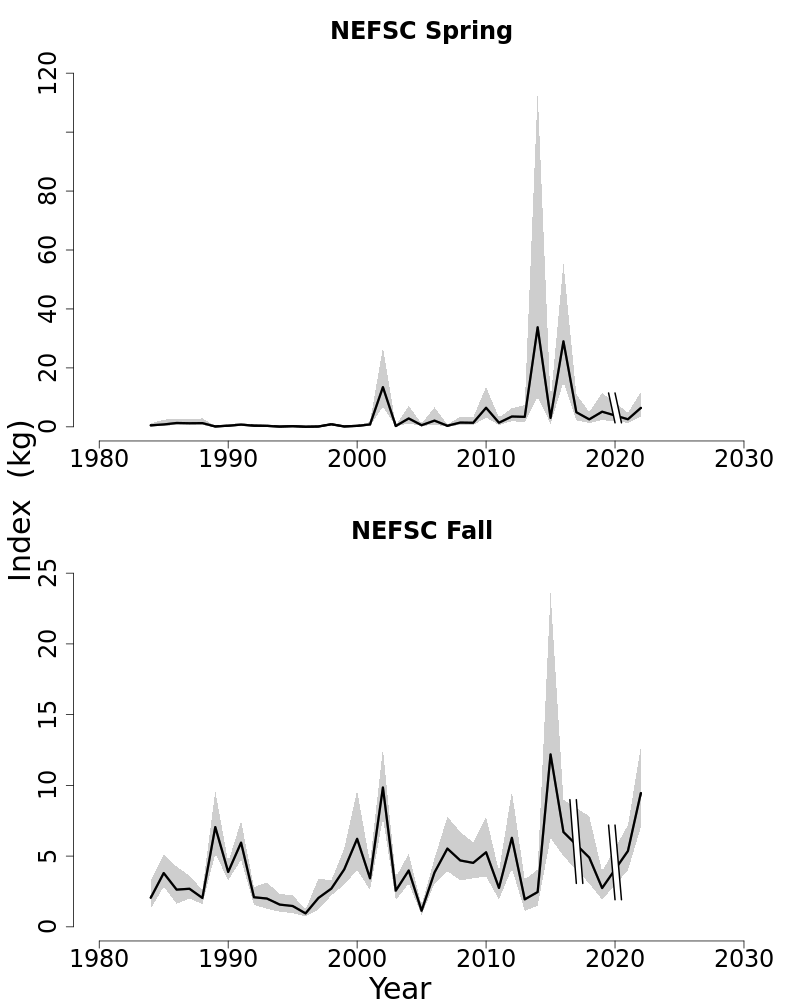
Figure 21: Indices of biomass for Scup between 1984 and 2022 for the Northeast Fisheries Science Center (NEFSC) spring and fall research bottom trawl survey series calibrated to Albatross equivalents. The approximate 90% log-normal confidence intervals are shown.
Photo Gallery
Here is provided descriptive text for the photographs and artwork that are scattered throughout the preceding pages.
-
Longfin squid well camouflaged on the sandy bottom. Photo NOAA. On page 43
-
Aerial view of the NMFS building and surrounds, Woods Hole Laboratory, MA. The enclosed body of water behind is Eel Pond. Photo WHOI. On page ix
-
Measuring the size of a deep-sea red crab. Photo NOAA. On page 34
-
Scup catch, in a basket. Credit: NOAA Fisheries. On page 63
-
Fresh seafood on ice, ready for sale. Credit: Shutterstock. On page iv
-
Shrimp, mussels, scallop, and fish dish. Credit: iStock. On page ii
-
Summer Flounder on pebbly bottom. Photo NOAA. On page 53
-
Aerial view of the buildings and wharves at the Woods Hole Oceanographic Institute, MA. Two research vessels are docked for re-supply. Photo WHOI. On page 15
-
Chaceon quinquedens (Atlantic Deep-Sea Red Crab), also known as Red Crab; range: New England/MidAtlantic. Artwork from NOAA atlantic deep-sea red crab website . On pages 32
-
Pomatomus saltatrix, commonly known as Bluefish, Tailor, Snapper, Baby blues, Choppers, Elfs; range: New England/Mid-Atlantic, Southeast. Artwork from NOAA bluefish website . On page 22
-
Doryteuthis (Amerigo) pealeii, commonly known as Longfin Squid, Longfin inshore squid, Loligo, Winter squid, Boston squid; range: New England/Mid-Atlantic. Artwork from NOAA longfin squid website . On page 41
-
Stenotomus chrysops (Scup), also known as Porgy, Maiden, Fair maid, Ironsides, Northern porgy; range: New England/Mid-Atlantic, Southeast. Artwork from NOAA scup website . On pages 61
-
Paralichthys dentatus, commonly known as Flounder, Fluke, Northern fluke, Hirame; range: New England/Mid-Atlantic, Southeast. Artwork from NOAA summer flounder website . On page 51