
PDF/UA examples, NOAA/NEFSC fragments
A selection of tagged tables
11 There needs to be a title at level H1, for PDF/UA-compliance.
The actual information contained herein will become available as anNOAA /NEFSC web publication.
Ross Moore
August 2022
REAL-WORLD TABLES — FISHERY DATA
The basic style adopted for tabular material is in accordance with the booktabs ²
²“The principal is that enforced structure of presentation enforces structured thought in the first instance.”
³,³U.S. Government Style Guide, 2000; tabular material
package. Supported rules are \toprule, \midrule, \bottomrule which can inherit a semantic meaning, instead of being for aesthetic appearance only. This extra semantics takes the form: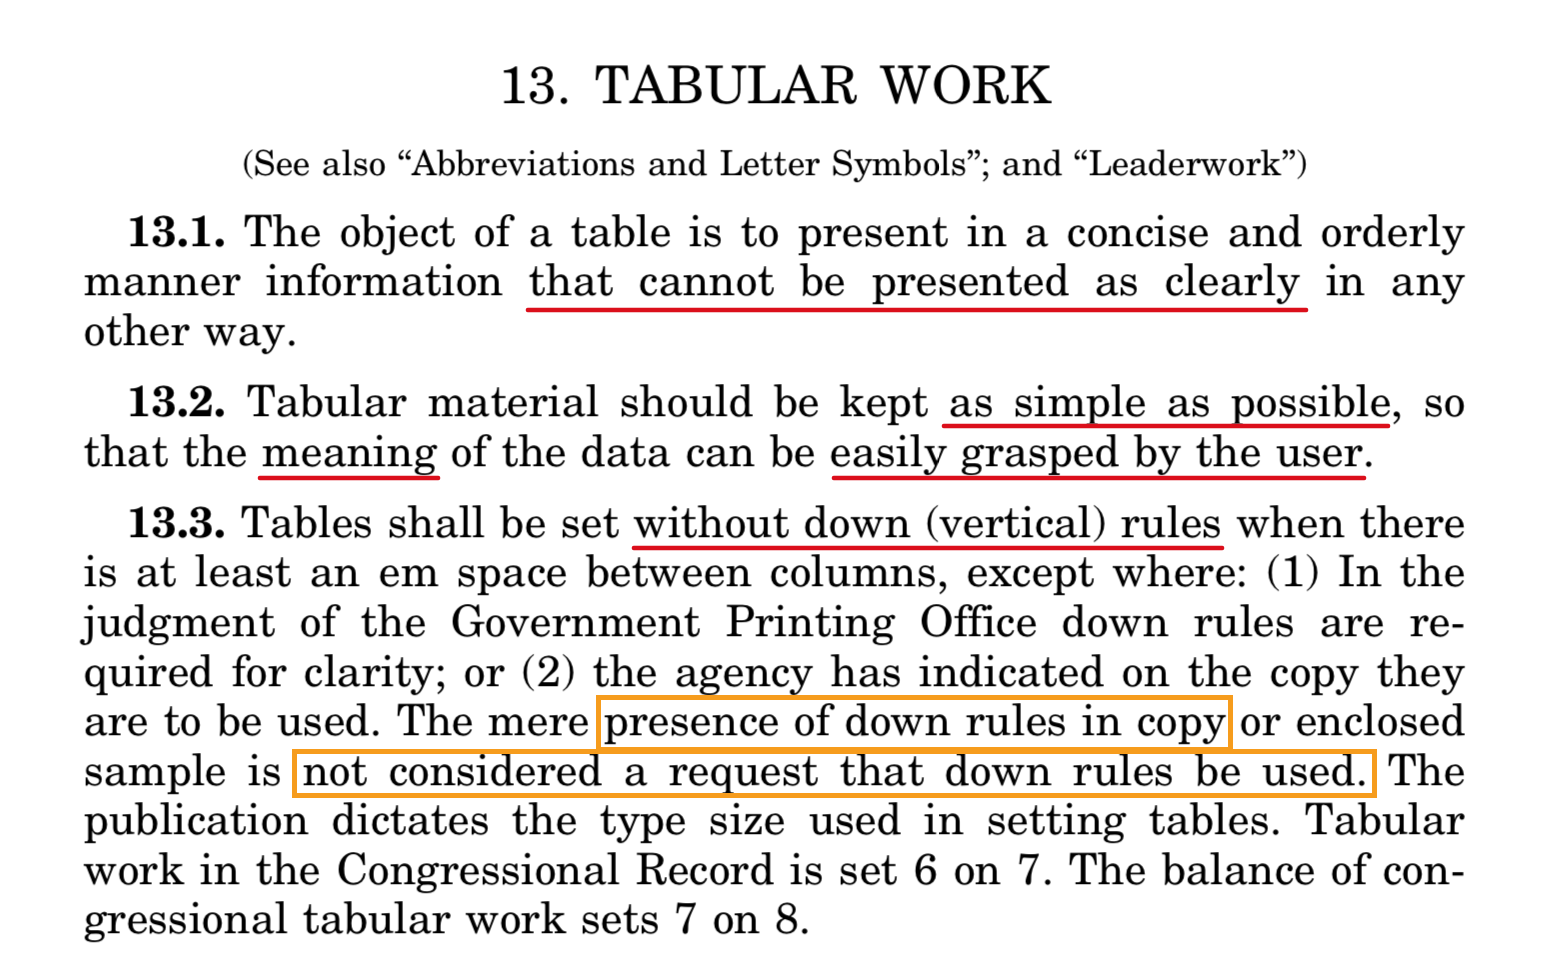
- •
\toprule indicates the start of a⟨THead⟩ block of rows;
- •
\midrule indicates the end of a block, with the following row starting a new⟨TBody⟩;
- •
\bottomrule indicates the end of the tabular; closing the final⟨TBody⟩ block of rows.
- •
When more than one \toprule and/or \midrule is used within the table, it indicates that a related block of rows occurs. These rows will have their own⟨TBody⟩. The PDF/UA format allows multiple⟨TBody⟩s to occur in a tabular, but only a single⟨THead⟩. Furthermore the previous row most likely contained header cell(s).
- –
When just a single header cell is present spanning all the columns, this can be presumed to be a header whose data augments the meaning of the following row headers; we call this a ‘row super-header’.
- –
When single cells occur in each column, these will be new column headers for the data in the following block of rows. Since a 2nd⟨THead⟩ is not allowed, this row and any preceding rows containing header cells spanning multiple columns, can be custom-tagged, provided this is Role-mapped to⟨TBody⟩.
- –
- •
Any usage of \multicolumn is presumed to indicate a related group of columns; the cell is then a ‘column super-header’ for the header cells of single cells in the columns beneath. Normal header cells for these columns might be in the next row, or sometimes in the preceding row.
- •
Use of \cline and/or \cmidrule helps clarify a hierarchy of headers, especially within the ⟨THead⟩; such that column header or super-header cells are found in both the row above and that below.
- •
Any usage of \multirow is presumed to indicate a related group of rows. Similarly to with \multicolumn, normal row headers likely occur in the next column.
- •
With no usage of \toprule nor \midrule, and no \multicolumn nor \multirow, the top row in a table is presumed to contain column headers, and the 1st column is presumed to contain row headers. This need not be the case in ‘toy’ examples (e.g., containing just a single row or single column); but in completed ‘real-world’ tables, this should not occur.
- •
The role of the top-left cell can be ambiguous. Usually it is a column-header for the row- headers in the 1st column. Alternatively it can be a row-header for the column headers in the 1st row; or be applicable to both rows and columns. It is also commonly empty, in which case it must not be designated as a header for any other cell.
Normal Table
| 2019 M=0.2 | 2019M-ramp | M=0.2 | M-ramp | |
|---|---|---|---|---|
| F MSY | 0.173 | 0.175 | 0.173 | 0.175 |
| SSB MSY (mt) | 42,692 (27,916 – 62,785) | 63,867 (46,144 – 84,098) | 39,912 (25,472 – 59,589) | 60,010 (41,916 – 80,517) |
| MSY(mt) | 7,580 (4,853 – 11,366) | 11,420 (8,149 – 15,268) | 7,171 (4,462 – 11,023) | 10,873 (7,439 – 14,841) |
| Median recruits (age-1) (000s) | 4,377 (1,161 – 14,434) | 8,464 (2,353 – 15,934) | 4,677 (1,064 – 16,392) | 9,249 (2,129 – 18,031) |
| Overfishing | Yes | Yes | Yes | No |
| Overfished | Yes | Yes | Yes | Yes |
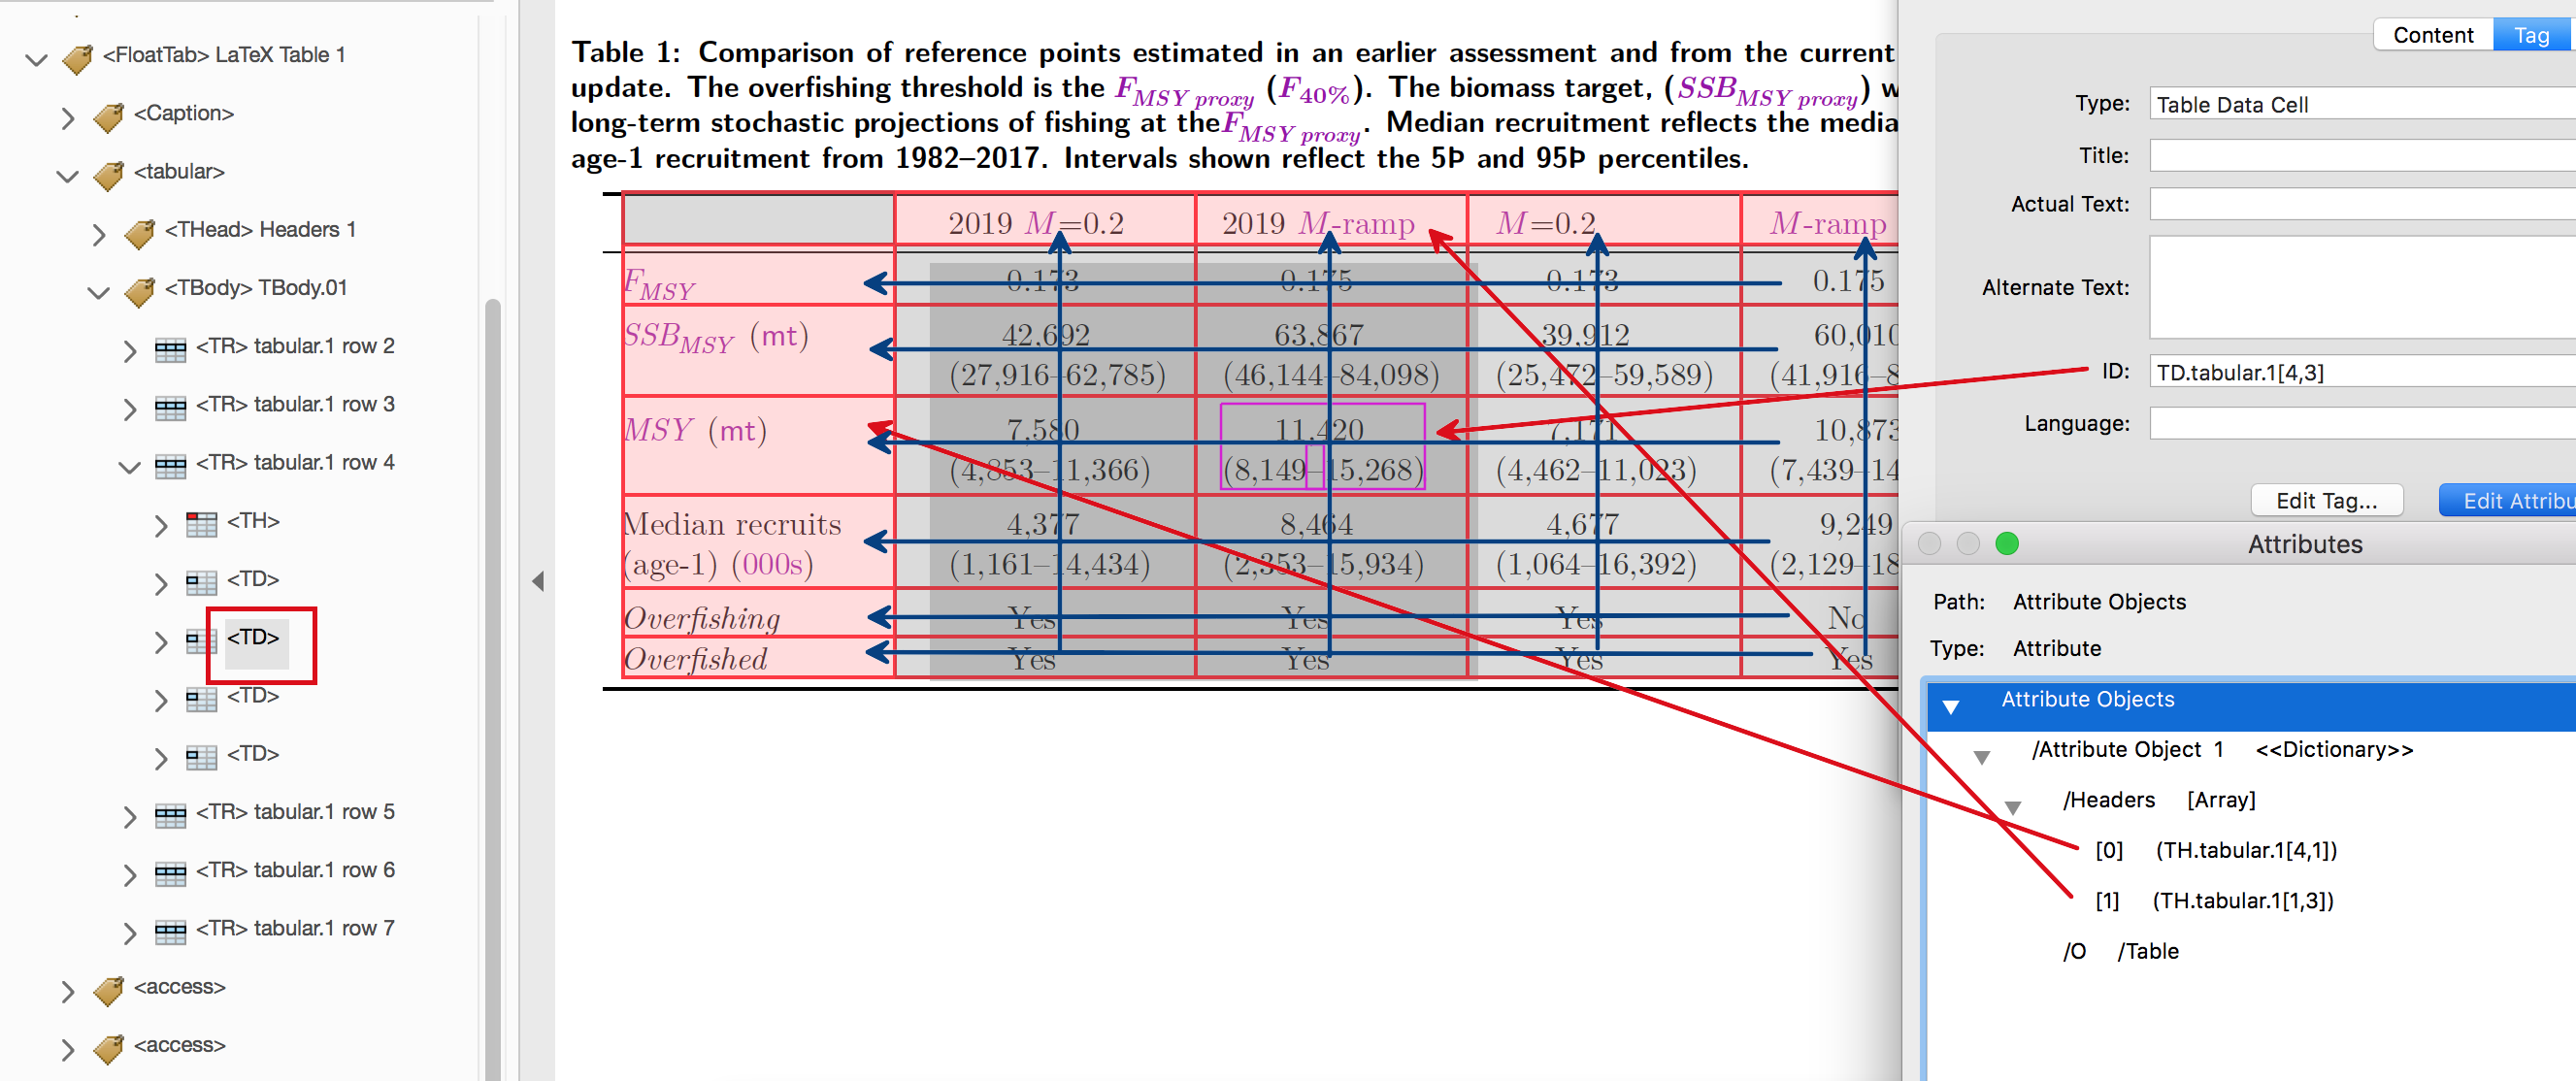
Each non-blank⟨TD⟩ data cell has a well-defined row- and column-head cell,⟨TH⟩, as indicated by the blue lines in the following annotated image.
Normal Table with 1st column header: super row-header
When the top-left cell is non-empty, it is usually a column-header for the 1st column, which consists of row-headers. This is an example of a ‘ super header ’; that is, a header cell for other header cells . The /Scope value for this header cell is /Column , since it is a descriptor for the cells in the column placed below it. We call this a ‘row super-header’ cell, as it is located from a data-cell by tracing the headers of its row-header. Typically a row super-header cell will occur within the 1st column, though need not always be in the 1st row of the table.
When the rows would be too wide for a page, the table can be turned sideways. See the next A page for the table resulting from the following LT X source. It is rather unfortunate that EAcrobat Pro cannot correctly find the bounding boxes of the cells when a table is rotated. Although the PDF is correctly tagged, screen-reading and navigation using Assistive Technology may be affected.
Source code for a sideways table with all row and column headers
\begin{sidewaystable}[htp] \caption{Stocks reviewed at September 2021 Management Track Assessment Peer Review meeting} \centering \Cut{columnRowComment}{\columnRowTypes{1}{2}{1}{2}}% \begin[\Paste{columnRowComment}]{tabular}{p{3.75cm} p{4.5cm} p{7.75cm}}% \toprule Stock & Lead Analyst/Presenter & Peer review conclusion \\\midrule \relax\hyperlink{AtlanticCod}{Gulf of Maine cod}\newline~\enDash\,Enhanced review & \newline Charles Perretti & Under retro-adjusted $\M\!=\!0.2$ model stock is overfished and overfishing is occurring. \newline Under \Mramp\ model stock is overfished but overfishing is not occurring. \\[28pt] \relax\hyperlink{AtlanticCod}{Georges Bank cod}\newline~\enDash\,Expedited review & \newline Kathy Sosebee & \newline Stock is overfished but overfishing unknown \\\bottomrule \end{tabular} \end{sidewaystable}
Table 2: Stocks reviewed at September 2021 Management Track Assessment Peer Review meeting
| Stock | Lead Analyst/Presenter | Peer review conclusion |
|---|---|---|
| Gulf of Maine cod – Enhanced review | Charles Perretti | Under retro-adjusted M=0.2model stock is overfishe d and overfishing is occurring. UnderM-rampmodel stock is overfished but overfishing is not occurring |
| Georges Bank cod – Expedited review | Kathy Sosebee | Stock is overfished but overfishing unknown |
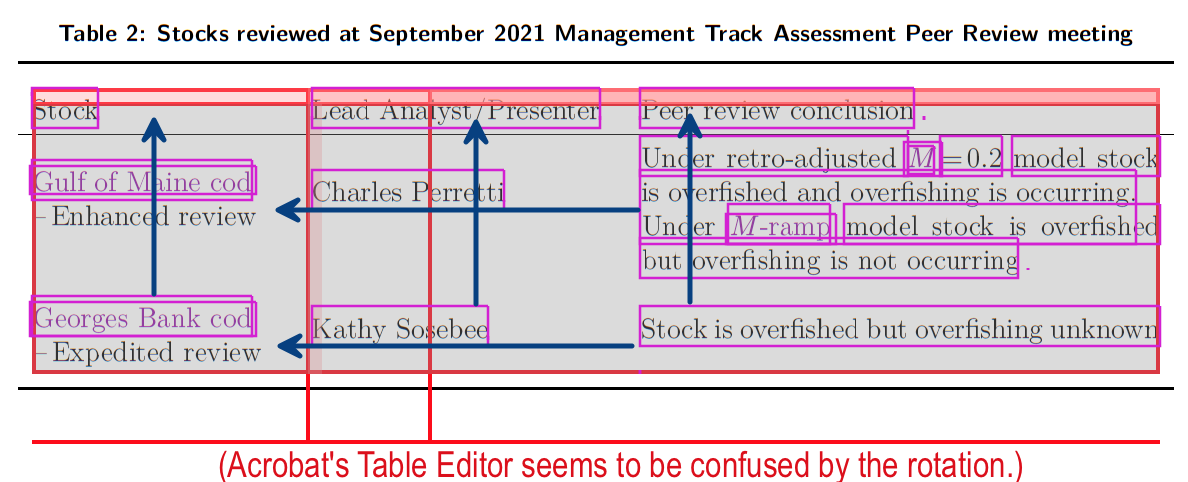
Acrobat seems to have difficulty correctly indicating the tagged material with rotation in effect.
There is no problem with the actual tagging tree; so not with text extraction for accessibility, etc.
Multiple Row Blocks
Here the data rows are divided into blocks (3 of them) each with a header cell that spans a whole row, using the \multicolumn{9}{...} command, which includes the 1st column. This creates a header cell which is essentially the column header for the 1st column (consisting of row-headers). Having a blank 1st cell in the top row is necessary for this interpretation.
| 2012 | 2013 | 2014 | 2015 | 2016 | 2017 | 2018 | 2019 | |
|---|---|---|---|---|---|---|---|---|
| Data | ||||||||
| Recreational discards | 103 | 195 | 151 | 168 | 334 | 617 | 340 | 111 |
| Recreational landings | 1,245 | 1,524 | 796 | 11 | 187 | 169 | 11 | 43 |
| Commercial discards | 97 | 54 | 27 | 14 | 8 | 16 | 17 | 7 |
| Commercial landings | 2,759 | 951 | 832 | 227 | 320 | 376 | 398 | 335 |
| Catch for Assessment | 4,204 | 2,723 | 1,806 | 420 | 850 | 1,177 | 766 | 497 |
| Model Results ( M=0.2) | ||||||||
| Spawning Stock Biomass | 3494 | 1826 | 1145 | 1184 | 1736 | 2126 | 2314 | 3083 |
| F Full | 1.66 | 2.16 | 2.37 | 0.43 | 0.59 | 0.61 | 0.32 | 0.16 |
| Recruits (age-1) | 1606 | 667 | 2119 | 804 | 530 | 966 | 3141 | 1298 |
| Model Results ( M-ramp) | ||||||||
| Spawning Stock Biomass | 4174 | 2288 | 1655 | 1859 | 2485 | 2776 | 2726 | 3223 |
| F Full | 1.46 | 1.85 | 1.74 | 0.3 | 0.44 | 0.49 | 0.28 | 0.17 |
| Recruits (age-1) | 3285 | 1484 | 4739 | 1699 | 1024 | 1717 | 5160 | 1981 |
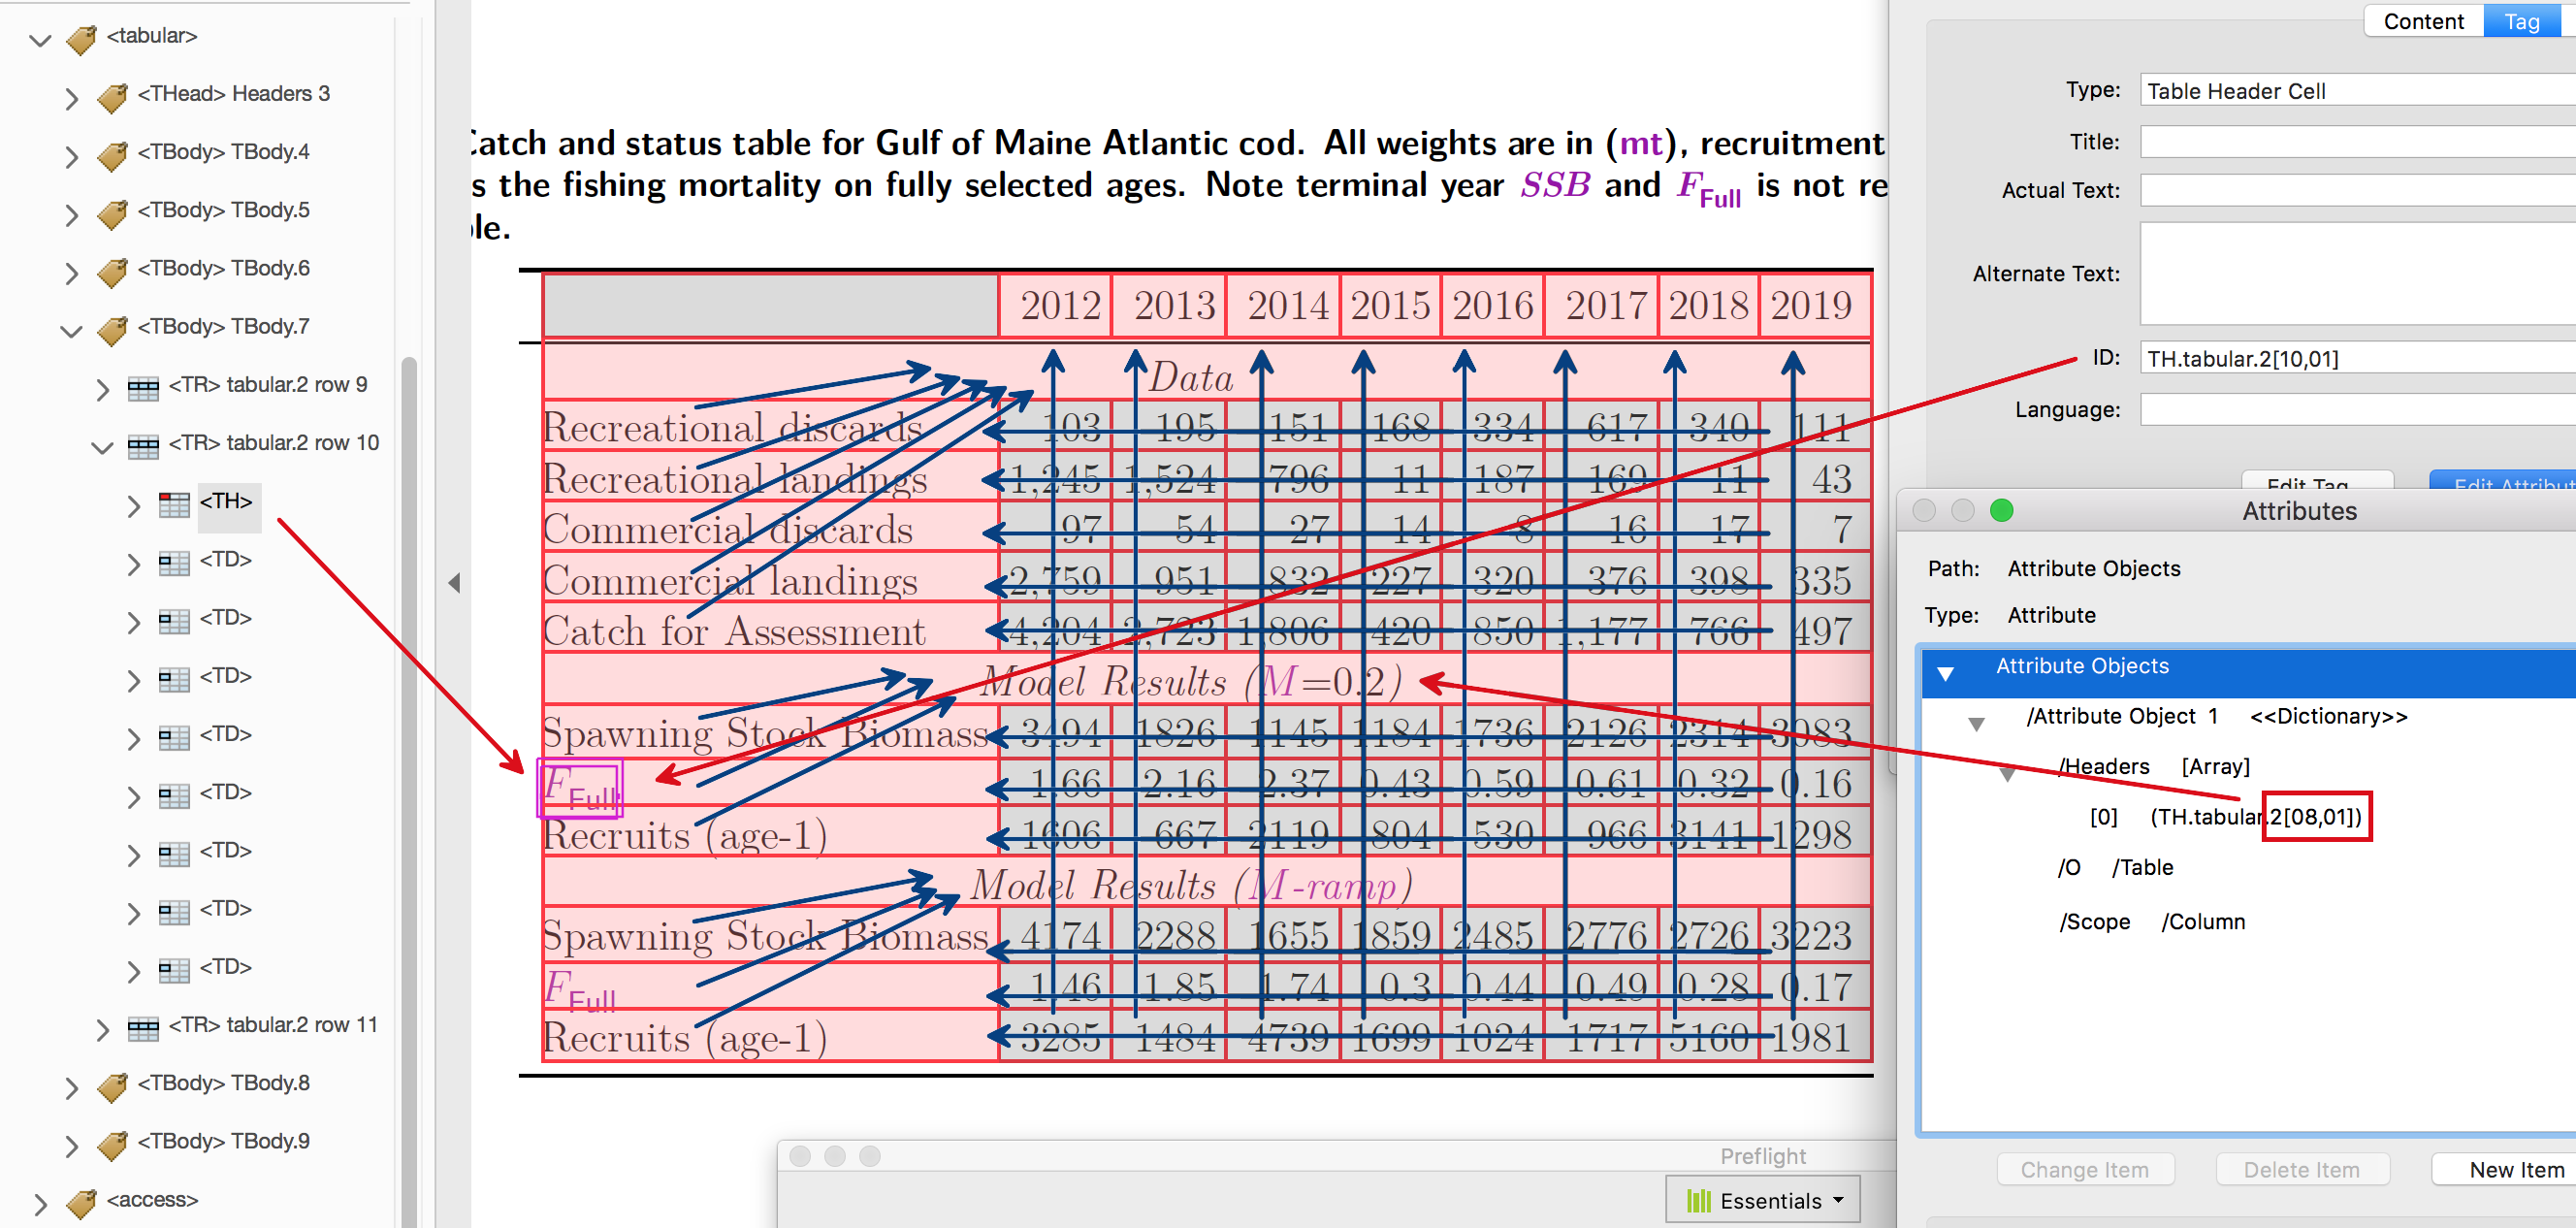
For greater emphasis of the different data blocks, a \midrule can precede the super-head cell, as shown below. Notice also how the /Scope of a super row-header is /Column , as its content is a qualifier for the row-header cells in the same (that is, the 1st) column, at least for the rows within the following⟨TBody⟩ block.
| 2010 | 2011 | 2012 | 2013 | 2014 | 2015 | 2016 | 2017 | 2018 | 2019 | |
|---|---|---|---|---|---|---|---|---|---|---|
| Data | ||||||||||
| Recreational discards | 24 | 18 | 11 | 8 | 4 | 13 | 3 | 2 | 4 | 2 |
| Recreational landings | 119 | 155 | 126 | 15 | 99 | 39 | 61 | 10 | 10 | 1 |
| Commercial discards | 153 | 298 | 482 | 206 | 64 | 82 | 125 | 101 | 108 | 105 |
| Commercial landings | 173 | 149 | 134 | 859 | 660 | 661 | 516 | 495 | 326 | 202 |
| Catch for Assessment | 469 | 620 | 752 | 1,087 | 827 | 795 | 704 | 608 | 449 | 310 |
| Model Results | ||||||||||
| Spawning Stock Biomass | 5,586 | 6,577 | 6,585 | 6,318 | 5,209 | 4,592 | 3,897 | 3,667 | 3,851 | 3,638 |
| F Full | 0.076 | 0.094 | 0.117 | 0.189 | 0.176 | 0.178 | 0.186 | 0.158 | 0.111 | 0.077 |
| Recruits | 6,448 | 4,579 | 4,251 | 2,321 | 4,219 | 4,955 | 5,238 | 3,211 | 6,185 | 3,293 |
Multiple Header Blocks
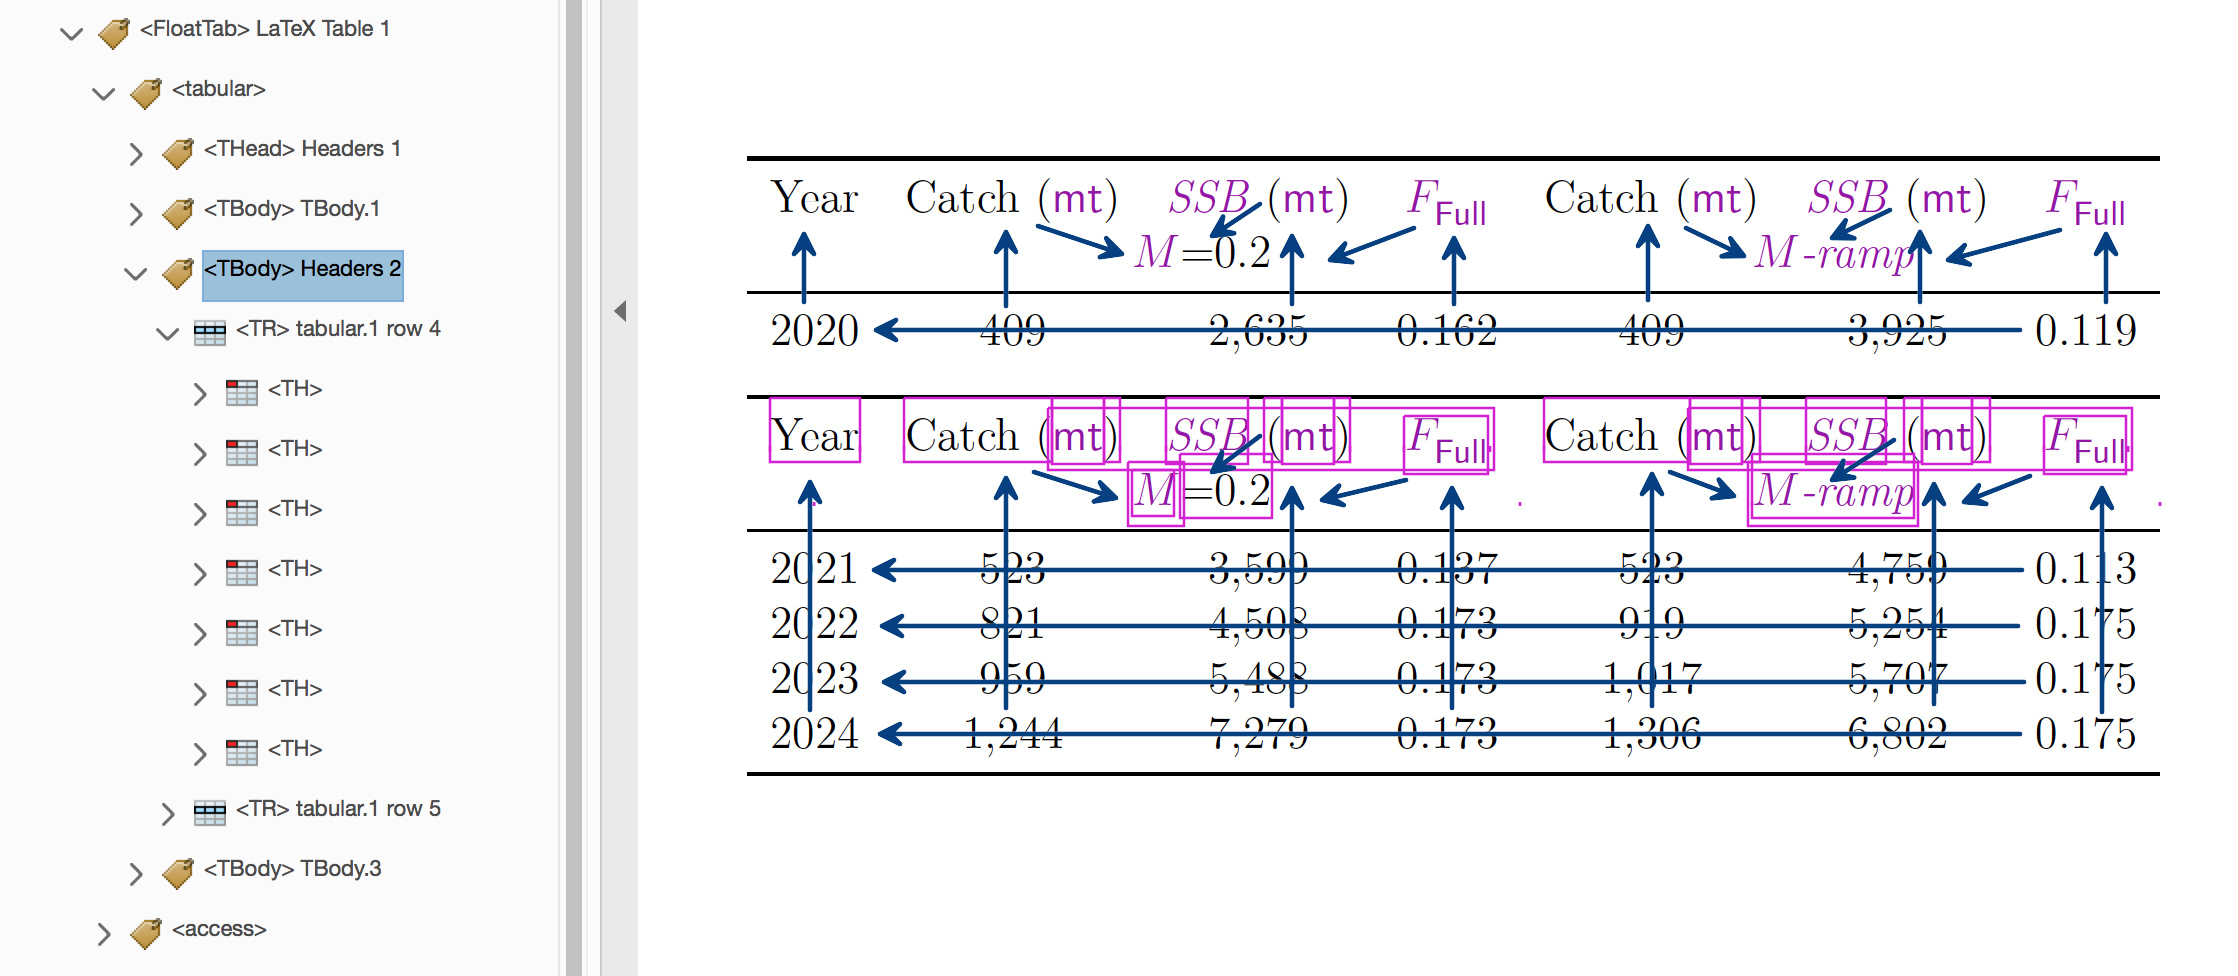
This example has multiple data blocks, where there is a header block explicitly specified for each. For comparison of different model results, groups of columns are associated with the different models. This gives ‘super’ column header cells, with textM =0.2 andM-ramp, spanning multiple columns using \multicolumn commands. Notice that the 1st column entry is blank on the rows where these occur, and that a \midrule comes afterwards, rather than before (as in the previous example).
| Year | Catch (mt) | SSB(mt) | F Full | Catch (mt) | SSB(mt) | F Full |
|---|---|---|---|---|---|---|
| M=0.2 | M-ramp | |||||
| 2020 | 409 | 2,635 | 0.162 | 409 | 3,925 | 0.119 |
| Year | Catch (mt) | SSB(mt) | F Full | Catch (mt) | SSB(mt) | F Full |
| M=0.2 | M-ramp | |||||
| 2021 | 523 | 3,599 | 0.137 | 523 | 4,759 | 0.113 |
| 2022 | 821 | 4,508 | 0.173 | 919 | 5,254 | 0.175 |
| 2023 | 959 | 5,488 | 0.173 | 1,017 | 5,707 | 0.175 |
| 2024 | 1,244 | 7,279 | 0.173 | 1,306 | 6,802 | 0.175 |
A ‘super header’ row occurs within the⟨THead⟩ block, having a \midrule beneath. The 2nd header block is tagged as⟨TBody⟩, with a \toprule above and \midrule below. As these ‘super header’ cells come after their column-header cells, their presence must be recorded in the history/auxiliary file. This enables them to be specified as a header for the real column headers on the next run.
Hierarchical column headers
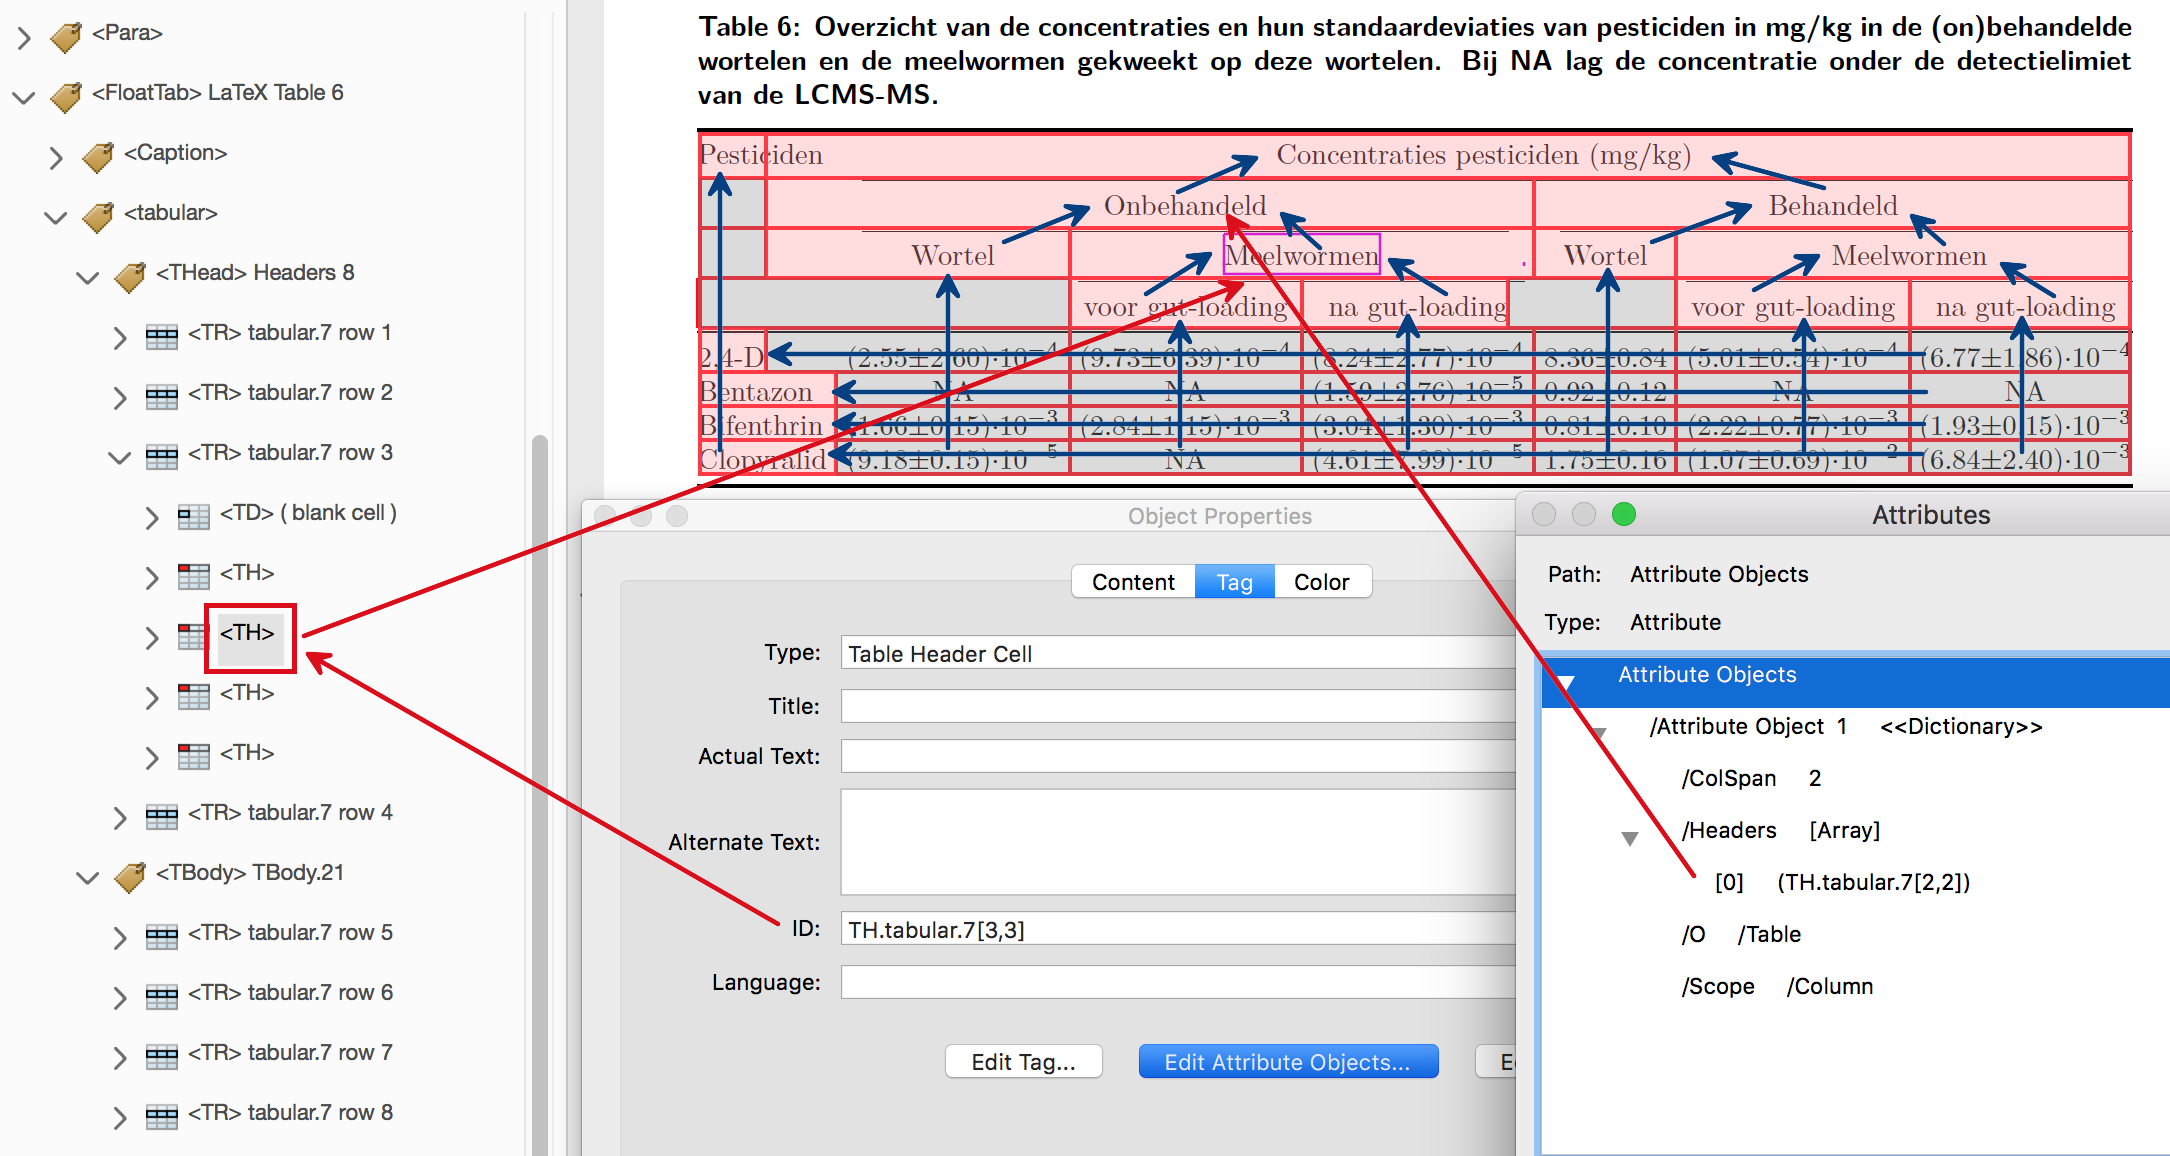
This next example is taken from T X StackExchange E . It has a binary tree of column-header cells.
Table 6: Overzicht van de concentraties en hun standaardeviaties van pesticiden in mg/kg in de (on)behandelde wortelen en de meelwormen gekweekt op deze wortelen. Bij NA lag de concentratie onder de detectielimiet van de LCMS-MS.
| Pesticiden | Concentraties pesticiden ( mg/kg) | |||||
|---|---|---|---|---|---|---|
| Onbehandeld | Behandeld | |||||
| Wortel | Meelwormen | Wortel | Meelwormen | |||
| voor gut-loading | na gut-loading | voor gut-loading | na gut-loading | |||
| 2,4-D | −4 (2.55±2.60)·10 | −4 (9.73±6.39)·10 | −4 (8.24±2.77)·10 | 8.36±0.84 | −4 (5.01±0.54)·10 | −4 (6.77±1.86)·10 |
| Bentazon | NA | NA | −5 (1.59±2.76)·10 | 0.92±0.12 | NA | NA |
| Bifenthrin | −3 (1.66±0.15)·10 | −3 (2.84±1.15)·10 | −3 (3.04±1.30)·10 | 0.81±0.10 | −3 (2.22±0.77)·10 | −3 (1.93±0.15)·10 |
| Clopyralid | −5 (9.18±0.15)·10 | NA | −5 (4.61±7.99)·10 | 1.75±0.16 | −2 (1.07±0.69)·10 | −3 (6.84±2.40)·10 |
Use of \multicolumn within the⟨THead⟩ in such a (binary) tree-like fashion allows the whole structure to be deduced in a single pass. Subsets of columns for one row are refined into smaller subsets on the next row. Each larger subset establishes a ‘super-column header’ for all the header cells below it. Singleton sets define the column-header for the data cells in that column. Thus each cell, head or data, has a well-defined column header at the time it is processed.
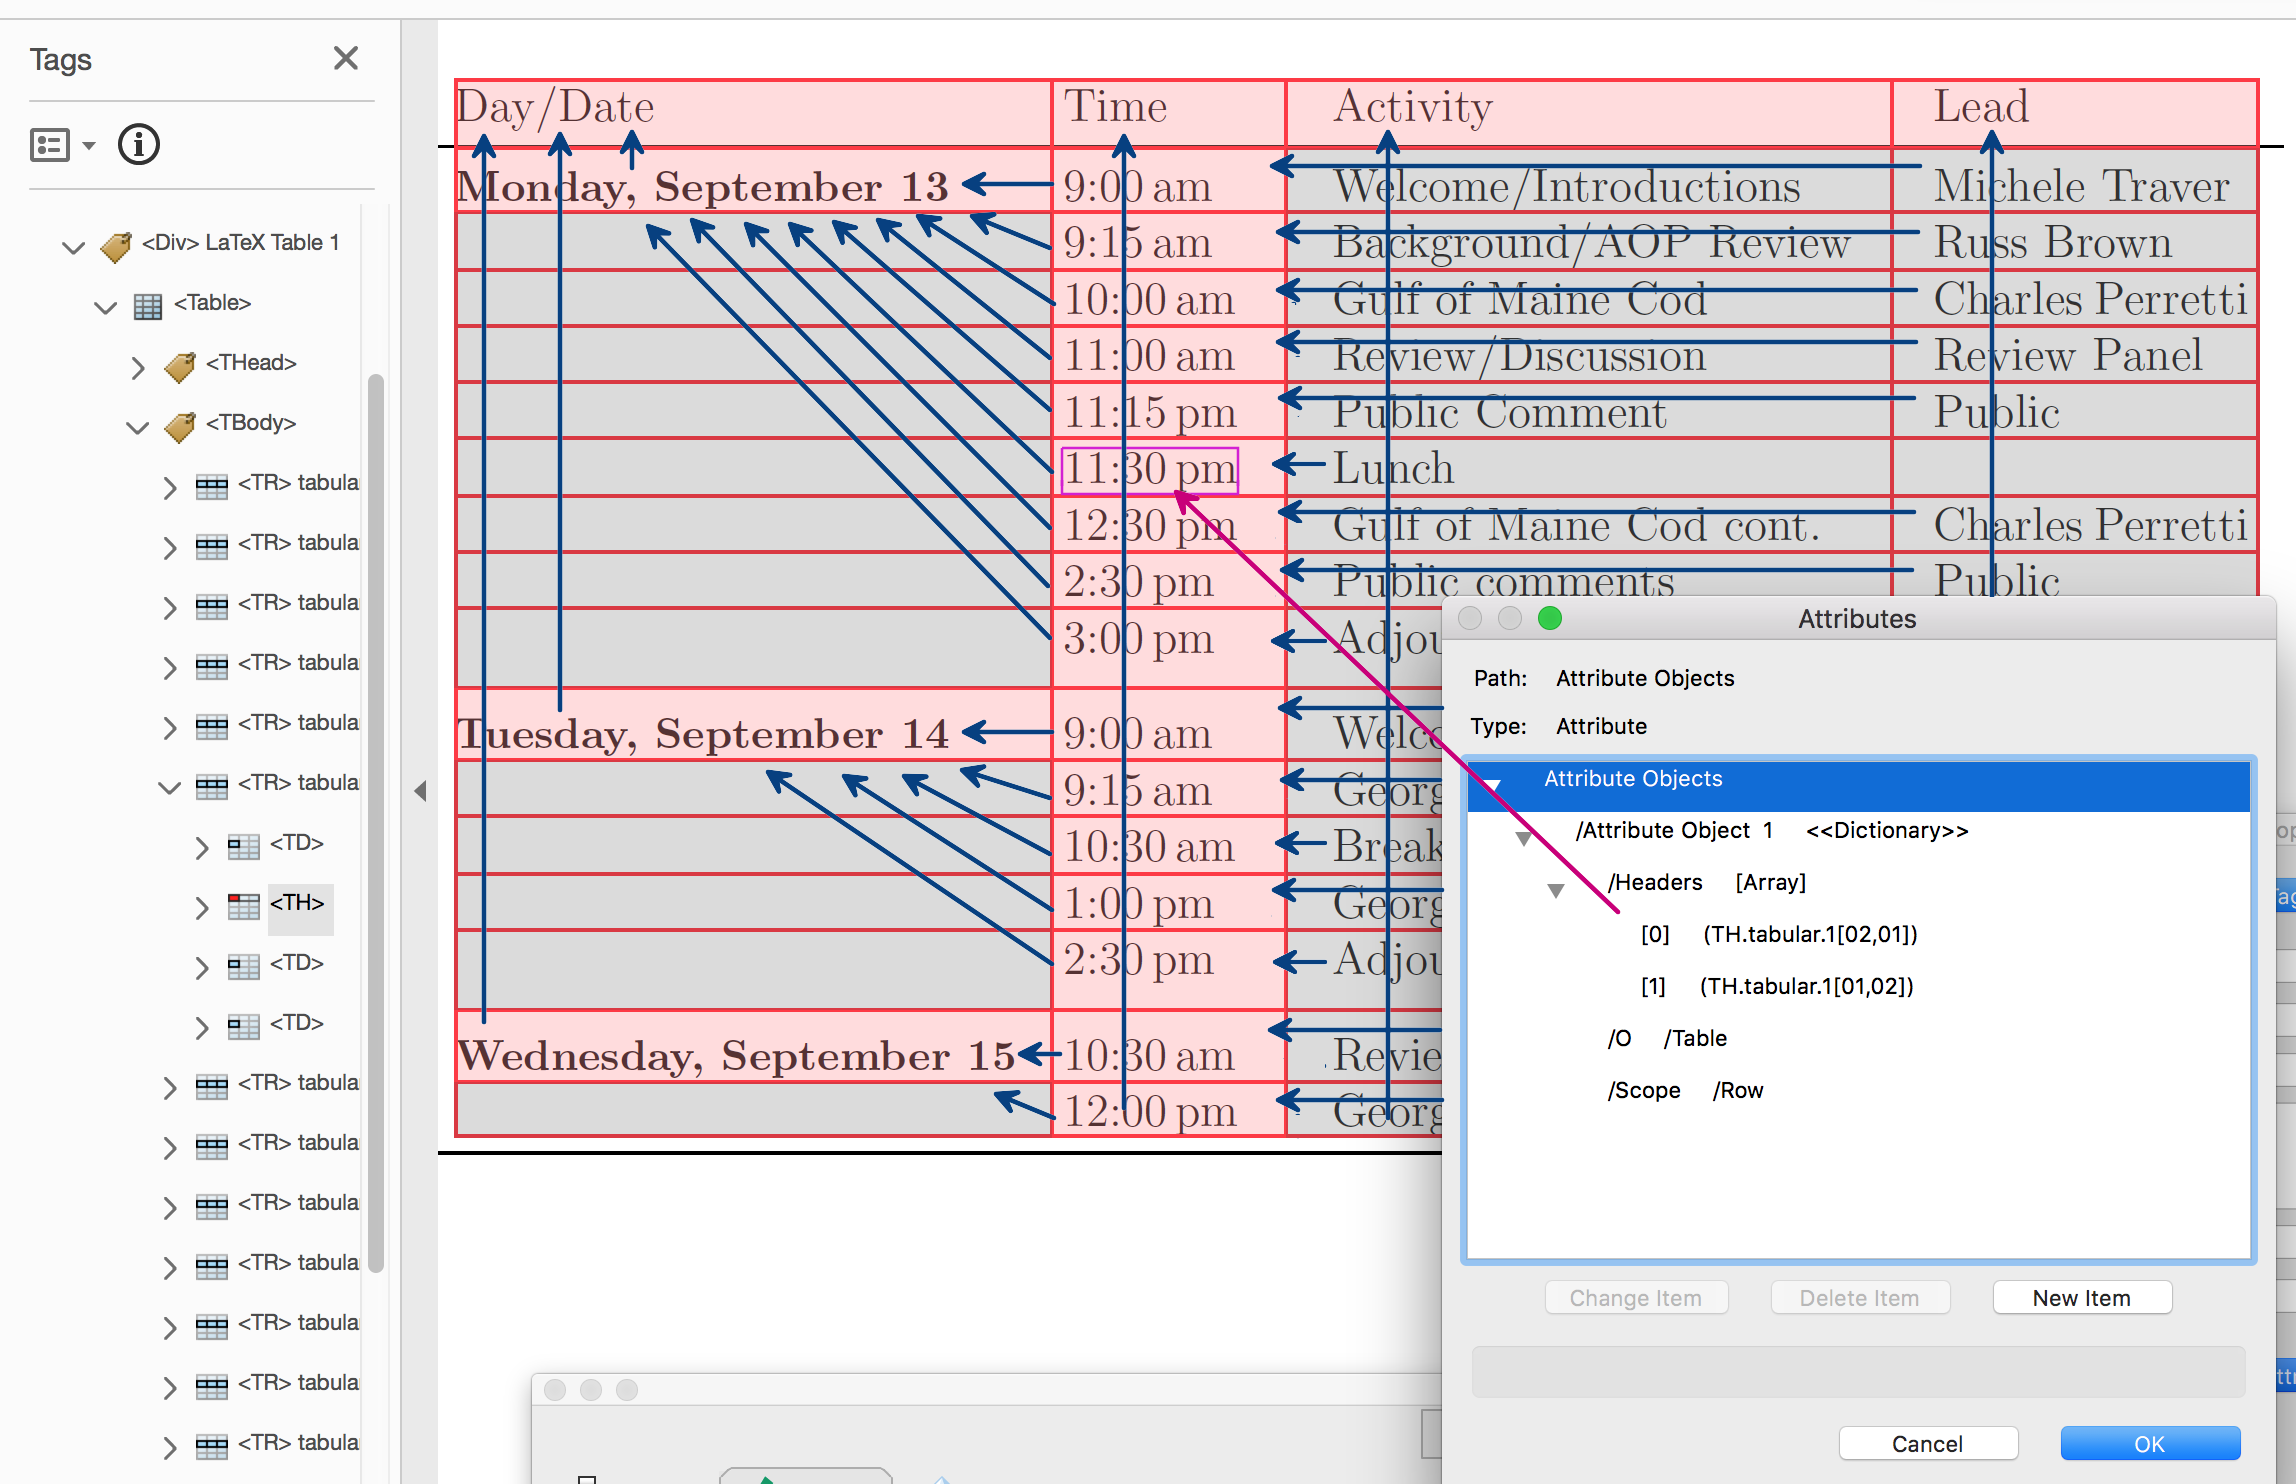
Multiple row-header columns
A calendar, or Meeting schedule, also has structured row headers, but only needs a single⟨TBody⟩ block. Row headers occur within the 2nd column, with the 1st column having the occasional ‘super’ row-header amongst mostly blank cells.
| Day/Date | Time | Activity | Lead |
|---|---|---|---|
| Monday, September 13 | 9:00am | Welcome/Introductions | Michele Traver |
| 9:15am | Background/AOPReview | Russ Brown | |
| 10:00am | Gulf of Maine Cod | Charles Perretti | |
| 11:00am | Review/Discussion | Review Panel | |
| 11:15am | Public Comment | Public | |
| 11:30am | Lunch | ||
| 12:30pm | Gulf of Maine Cod cont. | Charles Perretti | |
| 2:30pm | Public comments | Public | |
| 3:00pm | Adjourn | ||
| Tuesday, September 14 | 9:00am | Welcome/Logistics | Michele Traver |
| 9:15am | Georges Bank Cod | Kathy Sosebee | |
| 10:30am | Break | ||
| 1:00pm | Georges Bank Cod cont. | Kathy Sosebee | |
| 2:30pm | Adjourn | ||
| Wednesday, September 15 | 10:30am | Review Panel findings | Review Panel |
| 12:00pm | Georges Bank Cod | Kathy Sosebee |
Redundant/weak column headers
It is poor style to have long-winded headers, perhaps using multiple cells instead of just a single cell. However, this is not a good reason for failing to correctly identify what is a header for what other cell(s).
Here is such an example, based upon one of the earlier tables (now set in portrait).
Table 7: Stocks reviewed at September 2021 Management Track Assessment Peer Review meeting
| Fishing | Lead Analyst | Peer review conclusion |
|---|---|---|
| Stock | or Presenter | from this meeting |
| September 2021 | ||
| Gulf of Maine cod – Enhanced review | Charles Perretti | Under retro-adjusted M=0.2model stock is overfishe d and overfishing is occurring. UnderM-rampmodel stock is overfished but overfishing is not occurring. |
| Georges Bank cod – Expedited review | Kathy Sosebee | Stock is overfished but overfishing unknown |
The figure below shows how there are really 3 rows of headers, having content that looks like a single phrase when read vertically. With each new successive row, each non-empty cell inherits the rôle of being a column header, from the cell immediately above.
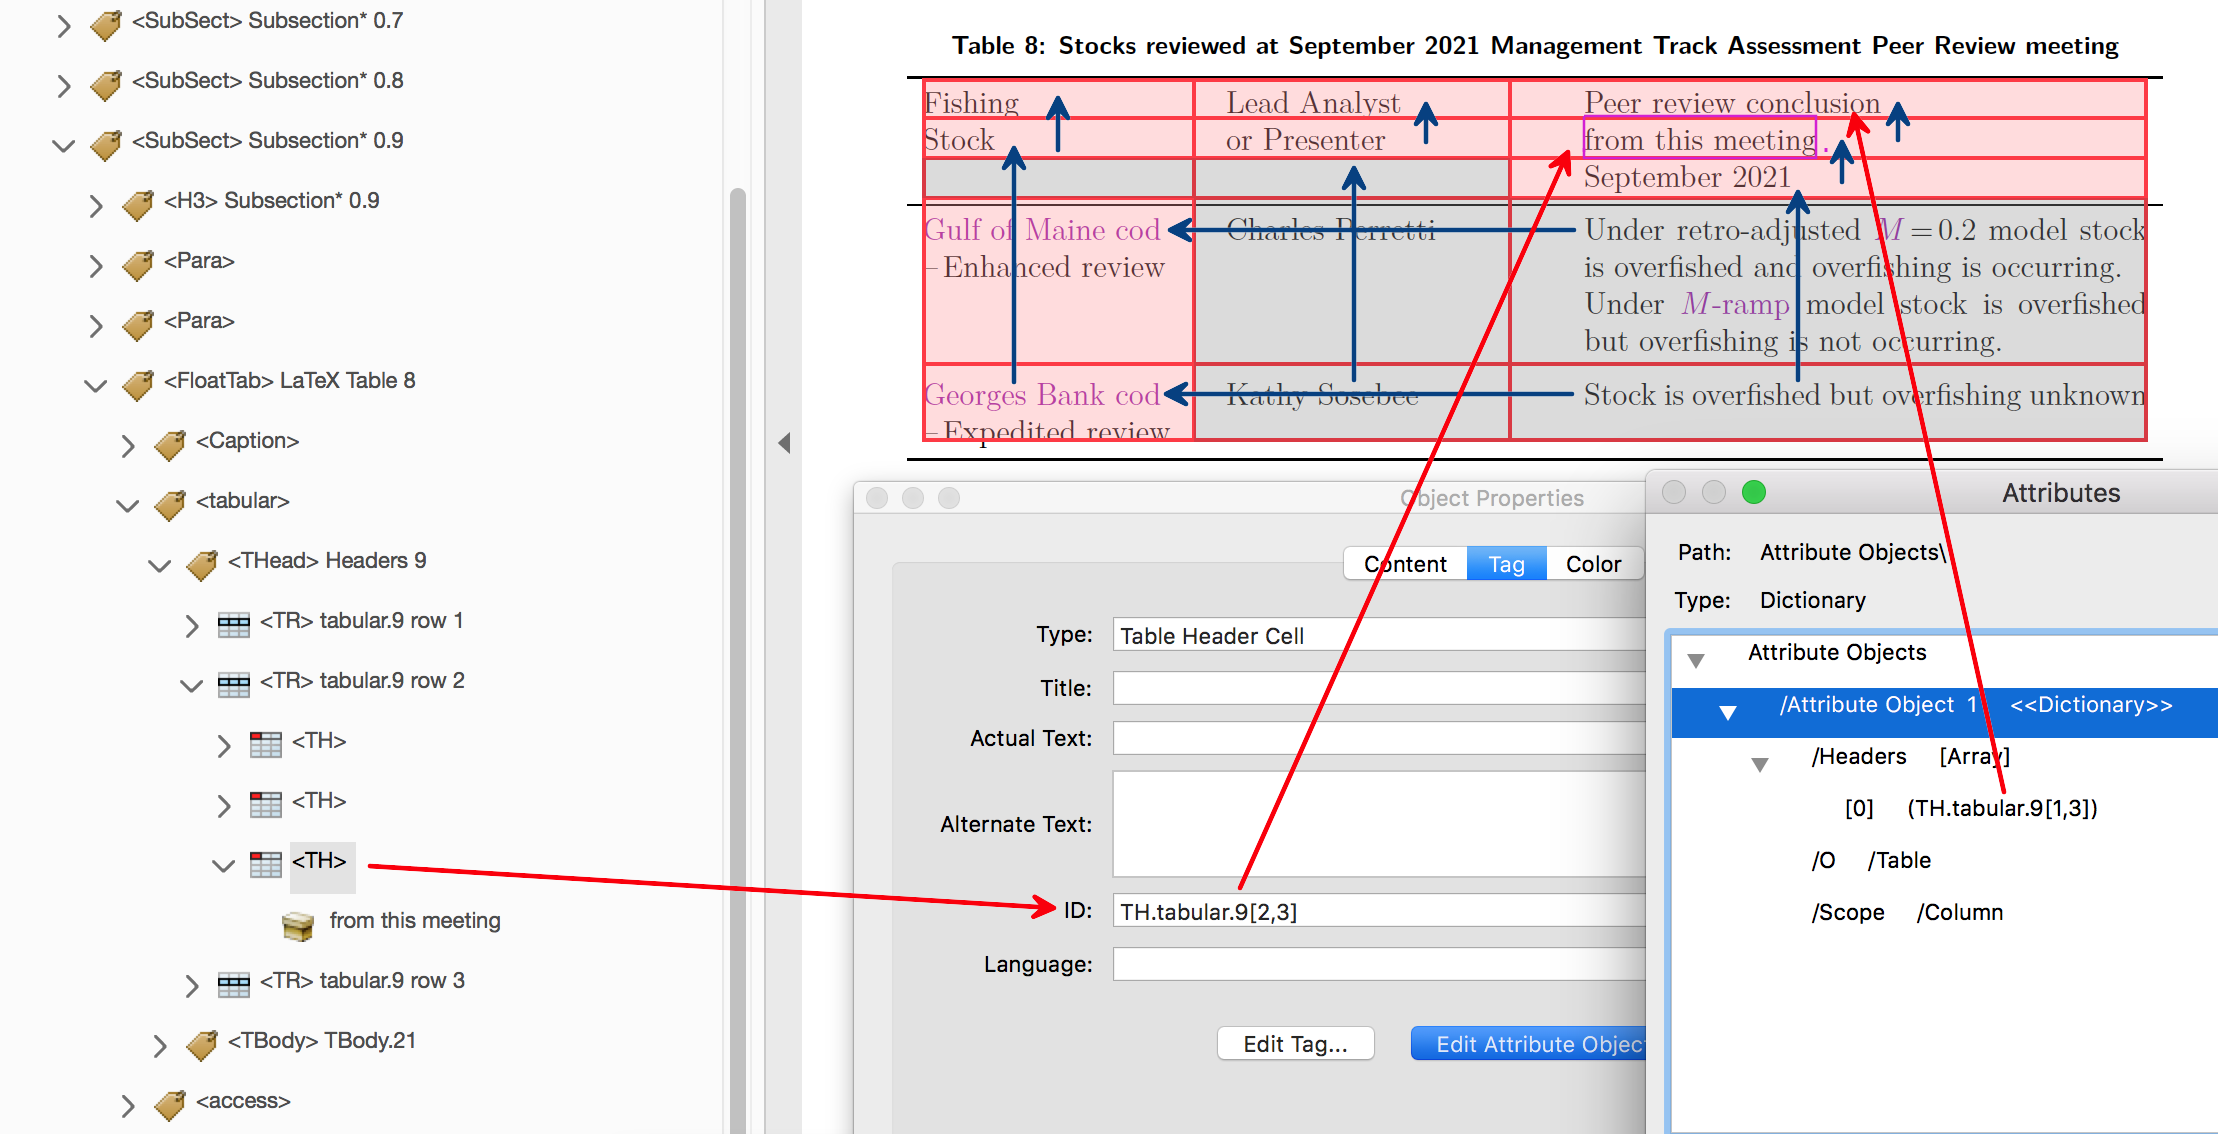
A drawback with this approach is that the information from these (weak) header cells is collected in reverse of the natural reading order. Thus it would be conceptually better to use single p-style cells, within a single row of header cells.